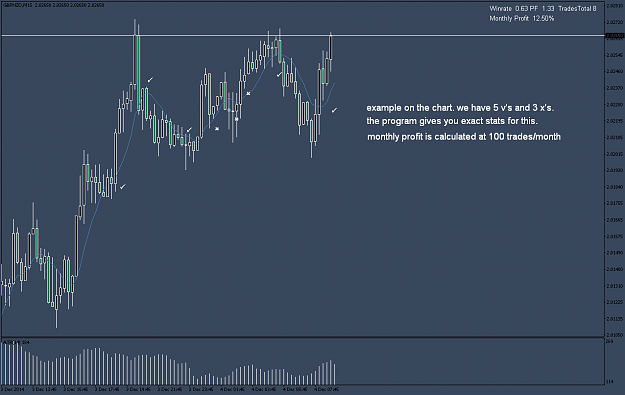
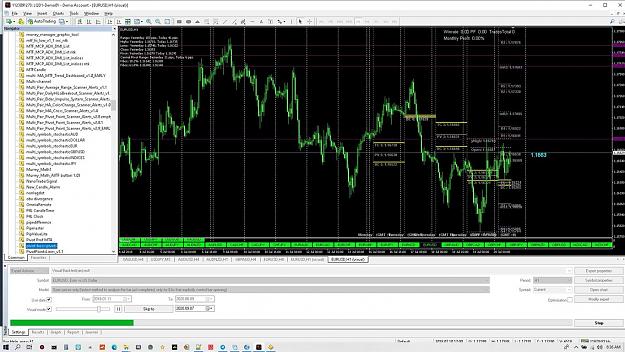
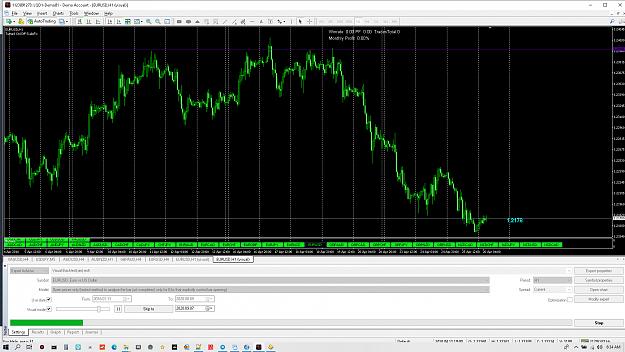
I wrote a tool which i use considerably in my backtesting. It is called Visual Backtest and there are 2 variants - Visual Backtest(sim) and Visual Backtest (chart). One is to be used a simulator best used with open prices only. The second is to be used with work on charts. All that you have to do is to use the v
's and the x's from the toolbox. the program will interpret them as a win or as a lose and will count them in order to show statistics. When you use the sim that will be done imediately on new info and when you use the chart variant you work and you drag onto the chart the expert . These are tools that i use for better experience with backtesting.
Pf1 means the risk reward . so if you have 1:1 the pf1 is 1.
test them out if you love working on charts like i do.
Attached File(s)


