I have decided that the 1h/4h strategy that started this thread is not for me. I am extremely impatient when it comes to waiting on a 4h candle to close in order to look for a trade and I loath watching big draw downs using large stop losses on longer term trades. With my personality I like to get in and out of a trade within a few minutes most the time.
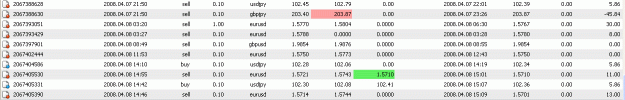
I have been trading live since 2/7/08 and in that time I have made 440 trades. 70% of these trades we positive winning trades, but the other 30% I lost twice and sometimes three times as much as my average winning trade. When I researched the reasons for my huge losses I found out that it was mainly due to the fact that I used bad money management and huge stop losses. I also found that when I had a trade go against me I had the urge to add more positions because I was right and this trade was going to turn around for me,,,,WRONG.
I have now adjusted my trading habits and trading rules to suit my style of trading. I think it is very important for any new trader to find out what style of trading they are the most successful with and continue down that road until they reach another eye opening trading experience that changes the way they trade yet again. I had one of these eye opening experiences when WaterFlame shared his trading method with me. You can find it here:
I will explain and share my new trading style all based off waterflame’s rules and template. I have made a few adjustments that suit me and I have changed a couple of rules to suit my style of trading as well. I will be covering all of this in my next couple of posts.
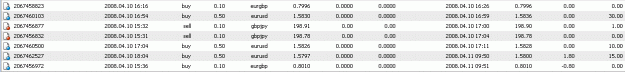
I'll be using this forum to track my own trades in a public manner to show other noobs how this noob is progressing. The trades you see above were my attempt at trading news. The biggest negative trade above (-$210) hit my stop loss and then turned back around after dropping another 20 pips to go into profit. I was a little upset by this but my new rules are when trading the E/U I trade with a 15-20 pip stop loss no matter what and I always let the stop loss hit. If I got a good entry my trade will go into profit quickly and I won't have to worry about my stop loss hitting. Trading the news yesturday I ended the day with a loss of -$31.
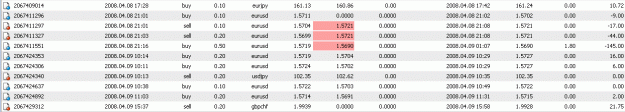
When I trade the P/J and other more volatile pairs I use a maximum stop loss of 40 pips. This can be a double edged sword on the P/J since 40-60 pip 15 min candles are a common occurrence. This stop loss makes my entry on such a volatile pair extremely important. I also use heavier lots on trades that have a small spread, trades that meet all my rules for entry, and trades that are in line with the short and longer term trend. Likewise I use fewer lots on trades that have a huge spread and do not meet all my rules for entry.
I am currently at a net loss since I went live, but I am closing back in on my initial account balance every day. The bottom line I think is each trader needs to find his or her own style (edge) and really work hard to get good at it. I have been involved in 4 different trade call/service rooms and my conclusion is that they are helpful but if you do not develop yourself as a trader and learn to pull the trigger on your own trades then these services might teach you some things, but you will be responsible for your own success in the long run. I think a lot of people get into forex thinking they will make themselves rich by trading. When they find out how truly difficult and how much hard work it is to become successful they go spend a boat load of cash subscribing to these trade call services/rooms/gurus and expect to make millions following somone who has done the work. Let me also just add this while I am at it: .. Any service that says you can make millions just by following their advice is a scam. I have been lucky enough to find a room where there are some professional traders that I follow to an extent. When they suggest a possible trade I go to work doing my own analysis and deciding whether or not the trade is good based on my own research, rules and trading style. I have missed some good trades by doing this but more often then not I have missed the bad trades.
One last observation. I'm sure a lot of you reading this have heard that 95% of traders fail in forex. I think 90% of these people are just not capable of being successful in forex without some major reprogramming that comes from education and a willingness to change. I am now trying to find out if I have what it takes to be one of the 5%.
I use a combination of waterflames template and the bottom indicators off the mandrake system for my main chart. I also use the 50ema -100sma -200ema on my 1h/4h/1d time frame and fibopivot.mq4 which I use for support and resistance lines. When I want to analyze a bit further I pull up another chart that has the 12ema(rarely used), 21ema, 50ema, 100sma, 200ema, Stochastics(13,4,4), Momentum(10), and CCI(31).
The Stochastics(13,4,4), Momentum(10), and CCI(31) are very similar to the red and blue mandrake blocks on the bottom of the chart above but they are actual moving representations rather than just blocks. I can look at them on another template and determine the strength of a possible move up or down based on the levels they are at and the steepness of the angle. Sometimes I will increase my lot size If it is a really strong move. I use the 15m chart as my standard time frame when looking for trades. I look at larger time frames to see the overall trend and the smaller time frames to see when a trade might turn around to go the other way. My entry is on the 15m chart.
The ema you will need to add to this chart is the 3 ema and the 34 sma. The clock and fibopivot can be found on post#1 in this thread.
Here is a cool little indicator that shows the open and close and the overlap of the different markets. The overlap between Asia and London lately has had some good volatility. As you can see this indicator also shows the high and low of the session. I have included my new template with along with the indicator below.
PS: This indicator is set up to show the sessions based on PST time, but you can set it up for any time frame you wish. I have not tweaked the time relating to the blocks yet so they may be off a little bit.
I had 5 trades today, two of which hit my 20 pip stop loss. Two other trades I bailed out of in a couple pips of profit when I saw the trade turning against me. I think the greatest skill of any trader is to know when to get out of a losing trade. I am feeling pretty good lately since I am getting better at this. With 2 crummy trades and 2 trades that hit the stop loss I still came out ahead due to my new trading style. My winning trade was less pips then both my losing trades but because I loaded up the winning trade I came out ahead for the day. I base my lot size on the confidence I have in that particular trade and my winner today had just the right setup to give me the confidence to go heavier on it.
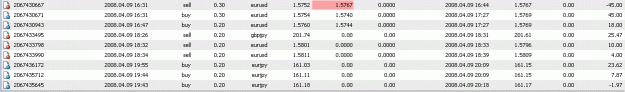
I took 10 trades today. Two of these trades I closed @ break even since I saw some indications that they might go against me which they did. The one negative trade was in 16 pips of profit at one point and I knew I should have exited, but with my P/J trades I try to get more pips then my g/u and e/u trades due to the higher volatility. I am happy my stop loss hit because if I left it open with a huge stop loss I would have had to wait 10 hours for it to get into profit. I feel good about my trades today since I used caution and stayed away from some pretty tempting set-ups.
I am reading your thread right from the 1st day. I am also a newbie like you. I am also struggling alot to become successful in this trading. I am sure you'll become successful in this trading soon... keep up the hard work & research and don't forget to share with us & we'll do the same...
Welcome to my thread. As you can see I have already learned some things, but I have a long way to go. WaterFlame helped get me going in the right direction. I will be happy to share anything I find with you if I think it will help. My goal is to be totally honest about my trades by posting all of them so people can see how I am doing. Yesterday I had a bad trading day as you will see in a little while when I post my trades. Anytime I have good trades I will try to explain what made them good and when I have bad trades I'll do the same. Hopefully we can both learn some things together. I saw you messaged me in aus's room. I follow him and one other person, but my trading style is different and It is rare for me to take anyone else’s trades unless they line up with my own analysis.
Well today was a bad trading day for me. I saw a perfect setup according to my analysis and I went light on the trade. Later I went heavy on an e/u trade that was in 14 pips profit. I usually take 10-20 pips profit on my heavy e/u trades. I was about to pull the trigger and close the trade in profit but I got greedy. It dropped and that was the end of that. I made one more mistake on the e/u that cost me. I normally use a 20 pip stop loss max on the e/u and this time I decided to move my SL to 30 pips since the trade just had to go into profit one more time. I was wrong. I felt like I was in a kind of funk. Hopefully in the future I can recognize when I am not in the correct mood to trade and close the platform.
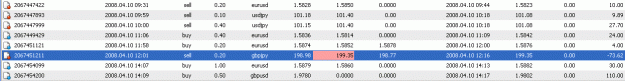
The fist 3 trades you see were my attempt at trading the news. Bernake was about to speak and normally when he speaks the market moves pretty wildly. These trades are more experimental than anything. I entered a hedge trade for the e/u right before the news. 3 mini lots in each trade and both trades with a stop loss of 15 pips. If the market makes a big move during an important news announcement I can let the market take out my stop and then the remaining trade will just have to make up the spread for both trades to be in profit. Often I will close the losing trade manually before the stop hits to increase my potential profit. Bernake was pretty vague with no real good news and no real bad news so I didn't catch a huge move. The market hit my stop loss on the first trade and 2 pips later it turned right back around and dropped to my original entry area. This is not what I expected, but I did some analysis and decided the trade was still good. I added another position and ended up closing my original trade out at break even while my third entry right after the news made some profit.
I have good intuition and analysis when it comes to exiting a trade at the proper time. Now I just need to work on learning when to stay in a trade longer to make the same amount of pips as my losing trades.
I took 8 trades during this morning New York session. I watch 6 different currency pairs and today’s trades were mainly done by watching the price action on all 6 pairs. A lot of the time when the USD/JPY is going down the EUR/USD is going up. So for example when the U/J made a big move down and the E/U did not make a similar move in the opposite direction I would analyze my chart and if E/U did not have any major resistance I would buy and exit my trade when the pairs got back into sync.
My one negative trade today was another instance where I broke my own rules to get into the trade. I follow some traders that have much more experience than me, but I only take trades when they line up with my technical understanding of the charts. Well, a trade was called and it was one of those "get in now" type of trades, and I took it without doing my own analysis. My stop loss hit, but the market never got up to my stop loss. It was my spread that actually hit the stop loss and closed the trade. 3 pips later it fell back down into profit. I live and learn.
I am sitting on a whopper of a bad trade right now and it has messed up my mojo. I am down 140 pips on a g/c 1 mini lot trade from last night. I entered a small short position at what I thought was the top of a big move up and it continued up so fast that I did not set my stop loss thinking it would turn back down. I have to try much harder to be diligent and follow my rules. If I would have set my stop loss @40 pips right away I would not be in this situation. The way I feel about my bad trade is preventing me from continuing trading today. I think some of my decision to get into this trade came from some commentaries I heard on forex tv and other places. This has led me to realize that Fundamental analysis is really tough to get right and to do my own analysis and not trust what other people say. The market has the final word on what it does no matter how many experts think it will go a certain way. This experience has turned me off to fundamental analysis. So far my most success has come from my own technical analysis. I am going to stay in this trade for a while and try to break even, but I may just exit so I can get back to trading without the stress of a negative position looming overhead.
No more live trades for me for one week. I am grounding myself. After I closed my wopper of a bad trade that was down 250 pips @-70 pips I opened 2 more E/J trades that I also did not set a stop loss for. Were they revenge trades? I don't know. Right now the E/J trades are floating. One of my most important rules is to immediately set a stop loss right away after I open a trade. I am going to spend the next week demo trading and make it a point to set my stop loss. I like the quote on the video below "Making money is my second job, protecting my profits is my first job". I'm mad at myself.
This thread will be dedicated to back-testing Auslanco-GBP/JPY Strength Indicator strategy based on my own rules. I will eventually be testing this strategy In my live account. I will also try to analyze trades live as they happen when my schedule permits.
I would like to start by thanking Auslanco for his amazing contributions to this forum. I will be using auslanco's strength indicator strategy with my own rules.
Summary of my understanding based on my 1H chart above: Using 4h chart determine Bear or Bull trend using QQE Strength Indicator. If green is below purple trend is bearish. If green is above purple trend is bullish. The red line in relation to the QQE SI does not matter on the 4h chart….all we are looking for is the cross of the lines indicating trend change. We can however use the angle of the lines to determine the strength of the trend. If the trend on the daily chart lines up with the 4h and 1h then we are looking for 300 pips. If just the 4h and 1h line up we are looking for 200 pips. In a bullish trade the stop loss is always 100 pips below the price where the green line on the 1h QQE SI crosses the red 50 line. Vice versa for bearish trade.
After determining a bullish trend on a 4h chart we need to make sure the 4h candle has formed above the Gann HiLow Activator line shown above in gold. If the 4h candle directly above where the QQE green line crossed the purple line (forming our bullish trend) has not formed above the Gann line we wait for the next 4h candle to form above before continuing to the 1h chart for confirmation.
On the 1h chart we first confirm our bullish trend by making sure the green line has crossed above the purple line on our QQE indicator and that the green line has crossed above the red 50 line. The exact spot where the green line crosses the red line in a bullish trend is where we are looking to buy. Before we can open our buy trade we need to make sure the 1h candle has crossed above the Gann line. Our entry will be the beginning of the second (confirmation) candle after the cross-over candle has closed. The closer our entry is to the 1h 5sma the better the entry.
RULES:
Since I can no longer update post #2 I will be updating my rules on this post from here on out.
Trading with 2 mini lots every trade with a 5k account balance. SL 100pips when in 100pips profit set 90pip TSL or manually close trade when 1h qqe trend changes. Whenever entry is further than 20pips from 1h 5sma enter ½ position or 1 mini lot. Enter full position when right @ 5sma. I will enter a maximum of 2 positions for each 4h trend change. I will backtest this strategy for approx 1year from now and post my results here. 3.23.07 NEW RULE: If the angle of the 4h momentum is flat or trending oposite the 4h QQE I will not continue to look for entry on my 1h charts. 3.24.07 NEW RULE: If I ever see 300+ pips profit I will change my TSL from 90 to 50.
Ignored
Dear,
can you told me what diff between QQE V2 and QQE V5 ???
Dear,
can you told me what diff between QQE V2 and QQE V5 ???
Ignored
Yes. V2 and V5 are exactly the same by default, but V5 has more alert options you can enable including visual alerts where V2 is very basic with some simple alerts. I used V2 when I was trying this system because I never used the alert options.
Yes. V2 and V5 are exactly the same by default, but V5 has more alert options you can enable including visual alerts where V2 is very basic with some simple alerts. I used V2 when I was trying this system because I never used the alert options.
I would like to repost an observation I made on waterflame's thread:
Hey guys. I wanted to share a sweet trade setup I just took on the E/J. I always look on multiple time frames to determine trends and support and resistance. With waterflame’s system I usually start by looking at the 4h to determine the strength of the overall trend.
The 4h was a bullish trend and when I saw the 1h 34 CCI coming up through the zero line as well as the 30m 34 CCI coming through the zero line I knew it was a great trade. I got in the trade a little late but I targeted 15 pips which was just shy of the R1 you see on the chart. I ended up getting out early banking 11 pips. I went in light since I don't usually trade the E/J.
You can also see the mandrake blocks all giving me a buy signal. Can you see how steep the CCI is? This is a great indication for the bullish trade. One last thing is I was above all the moving averages which is a good sign for the bulls.
I have started studying the James 16 method in the goal of continually increasing my forex knowledge and I noticed that he said something that will bolster my beleifs in studying multiple time frames:
James16 "Another thought for every one. I made the comment a couple of posts ago about sometimes risking hundreds and sometimes thousands. When I see a daily price action set up on a daily chart and it is on a large fib ret I then switch over to a 60 min to see if I can fine tune an entry. If the 60 min is in sync with the daily I then go to a 15 to narrow it down. I look at all time frames to see if I can find an entry that will allow me to enter with as small a stop as possible. When long, mid and short term are screaming the same thing its then that I take a big swing.”