Hello Trades ![]()
I hope you all making some little money ..
Today, I want to share my really great work to you, just for free
I called it MrR Charts Dashboad - So, Charts because it contains 3 mini chart and Dashboard because it also contains more information about you account.
It is the first version 1.00 and I'm planing something more for it and when I will done, I will update the thread.
So, let's explain
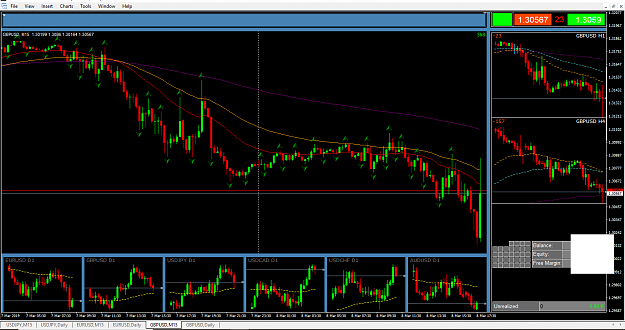
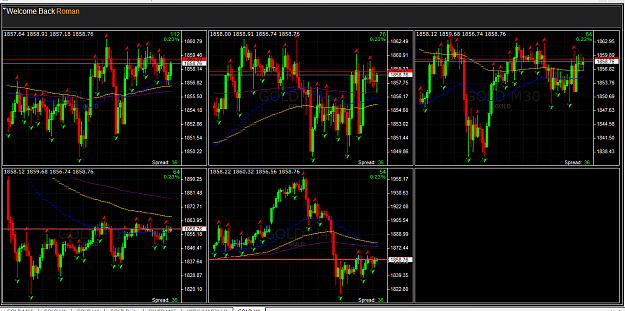
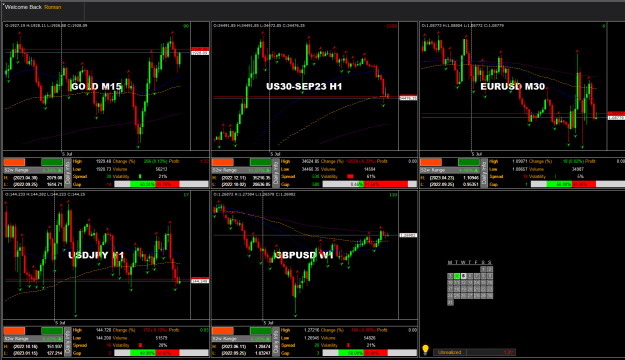
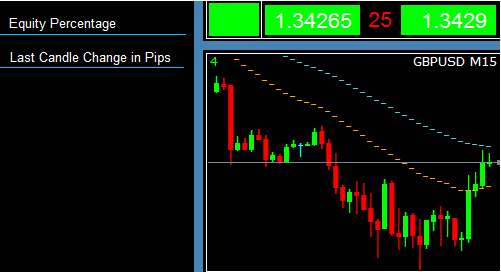
Firs of all, I'm gonna say that the indicator gives you a possibility to use 3 mini charts, where you can use 3 different Time Frames and/or 3 different Symbols. Charts also has a Bid Line, possibility to see the OHLC price on every candle on Chart (you just move mouse on candle) and every chart has its own last candle pips change information. Chart also has 3 different Moving Average where you can set the Method, Period and Color or just disable it if you wish. So, let's see first picture.
Attached Image (click to enlarge)
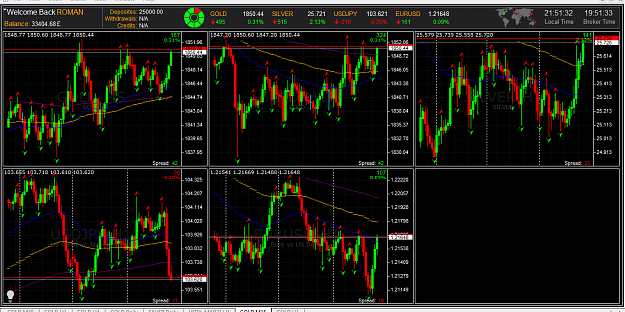
In this picture, every indicator is enabled. If you have small or big Monitor (Actually I have 17 Inch Monitor :/ ) you can Disable or Enable some indicators, like on the picture bellow.
Attached Image (click to enlarge)
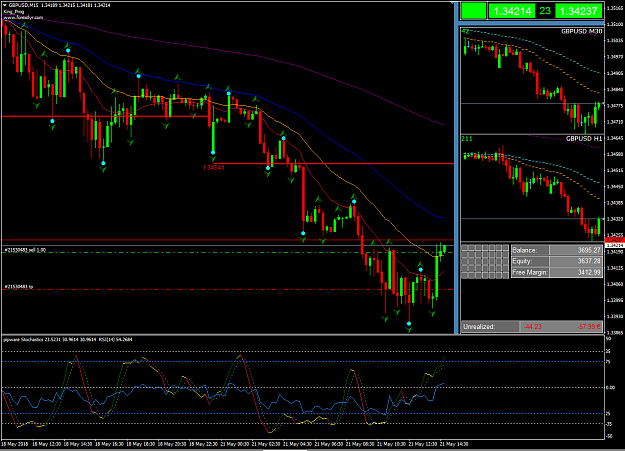
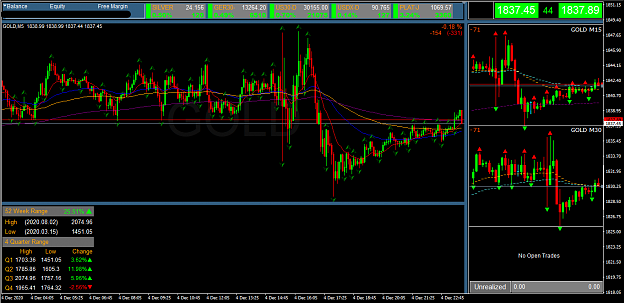
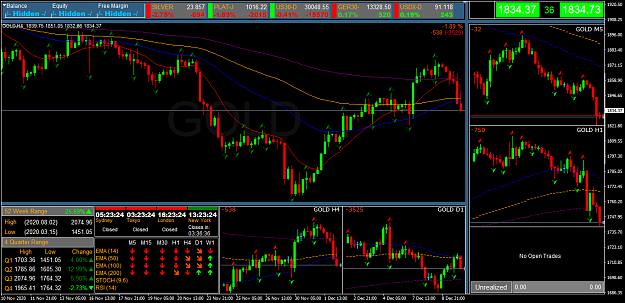
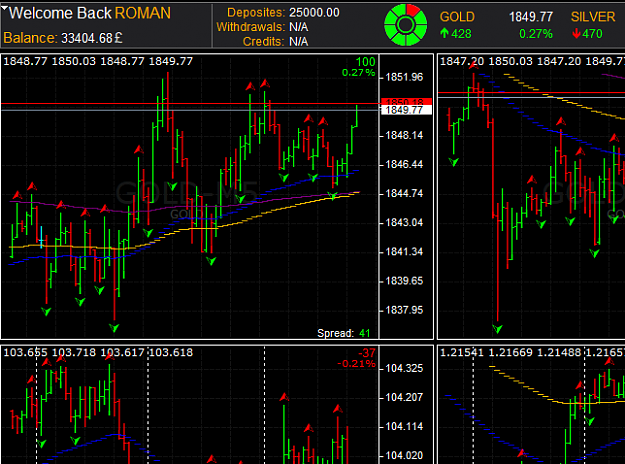
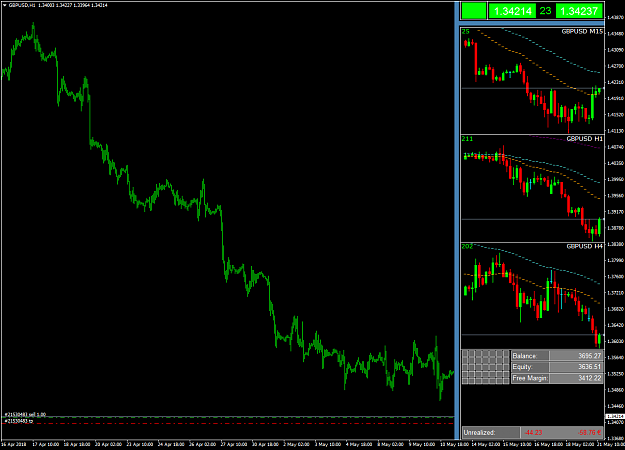
So, as you can see, I'm using only 2 Charts because I have added a Stochastic Indicator on Main Chart and I have just removed 1 Mini Chart because like I said I have small Screen. But what if I need 3 Charts and don't need the other indicators? See picture bellow
Attached Image (click to enlarge)
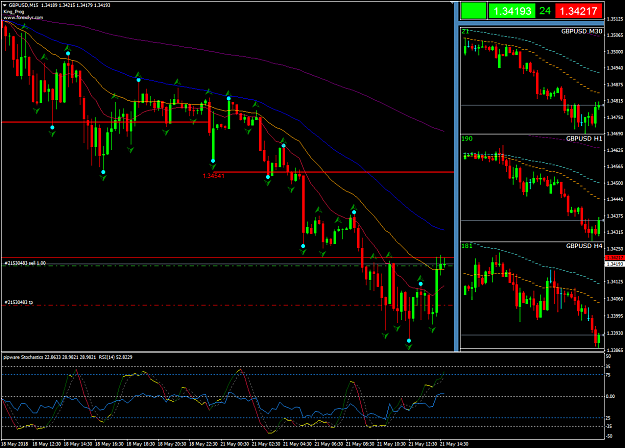
You can just Disable them. Every indicator has its own TRUE/FALSE Mode.
Dashboard also contains more useful information, like Bid and Ask price which backgrounds are changing its colors when it goes Up or Down and between them you can see a Spread.
Attached Image
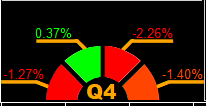
And also it has an Equity Percentage information. It works like that: if your equity is more then 85 percent, the Cube is Green, if equity is between 85-70% then Cube will be Orange and if it goes bellow 70% then cube will be Red.
And bellow indicators which gives you an information about you Balance, Equity and Free Margin. Also you can see your Gain or Loss information, which has 2 different Info, this is indicator Unrealized. On the left side you can see your Gain/Loss for current chart and on the Right side you can see your Gain/Loss for all your open trades. More information you can see on the indicator actually
Well, you might have a question, what the hell is those cubes for?
So, that's it for now and like I said, when I will update MrR Charts Dashboard for newer version, I will share it again
"Rule No.1: Never lose money. Rule No.2: Never forget rule No.1." — Warren