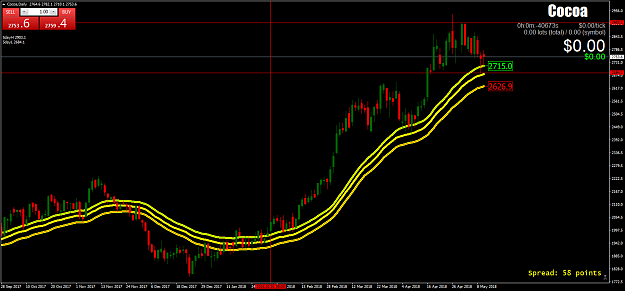
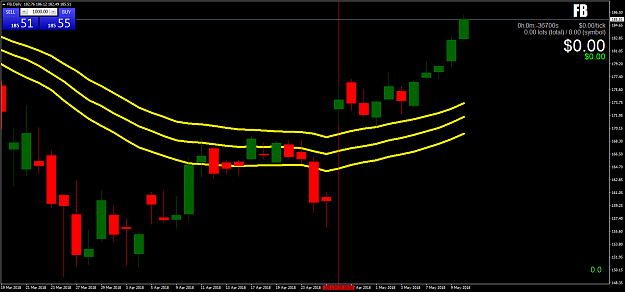
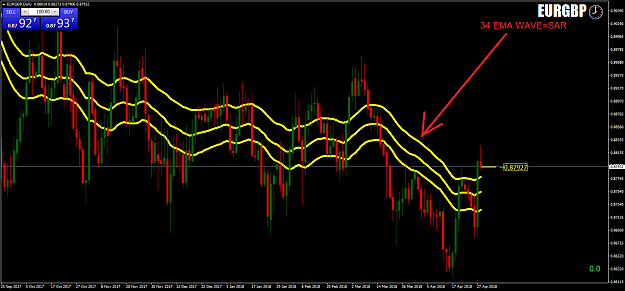
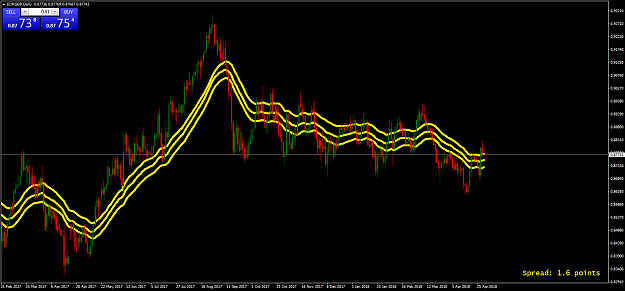
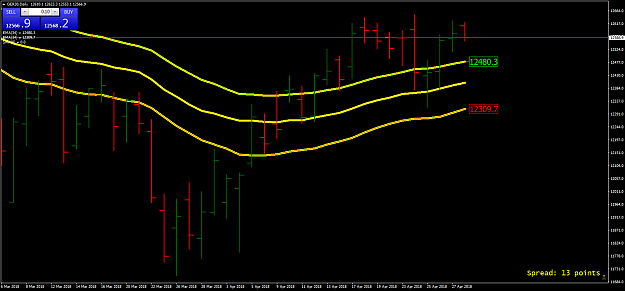
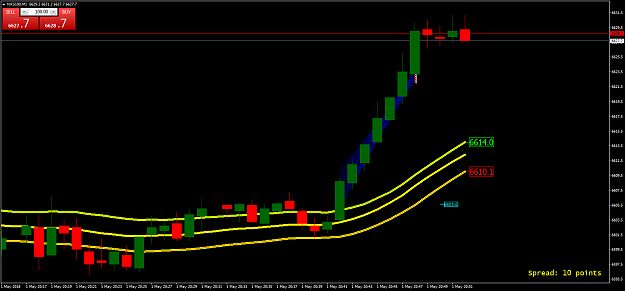
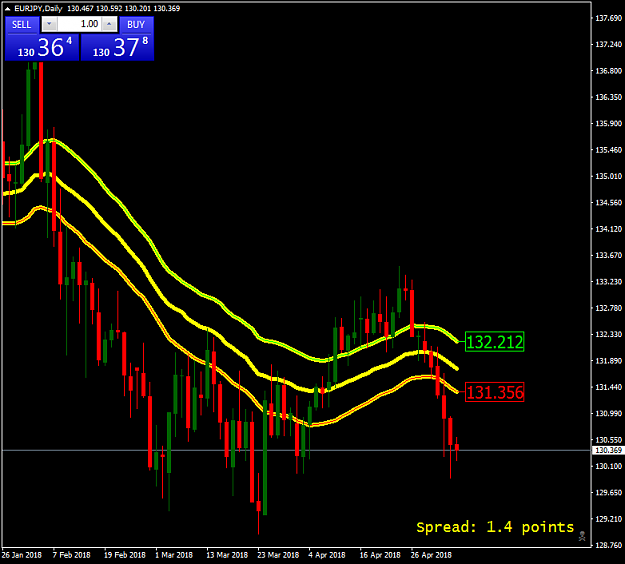
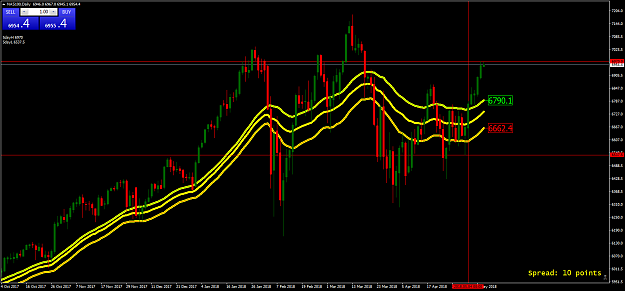
34 ema high,low and close
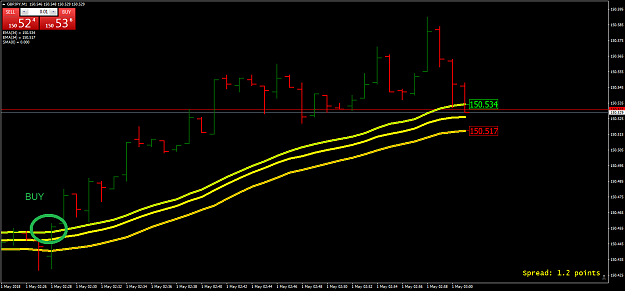
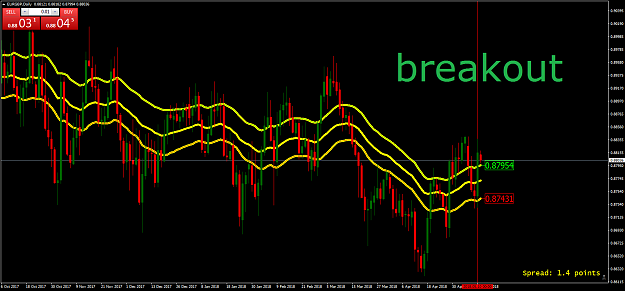
Buy breakout:
Buy market when the price breakout
and closes above the 34 ema high
If long the Stoploss is 10 days low or a close below the center line.
Where to take profits?
===========================================
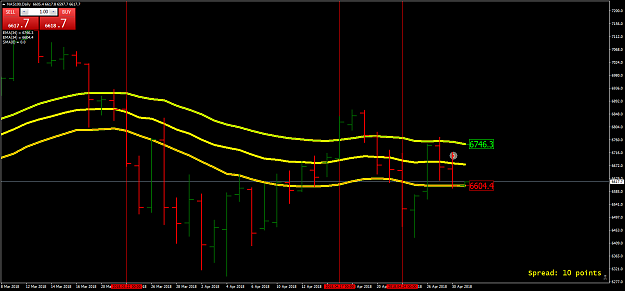
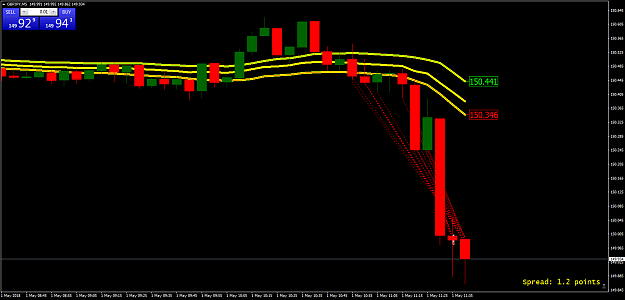
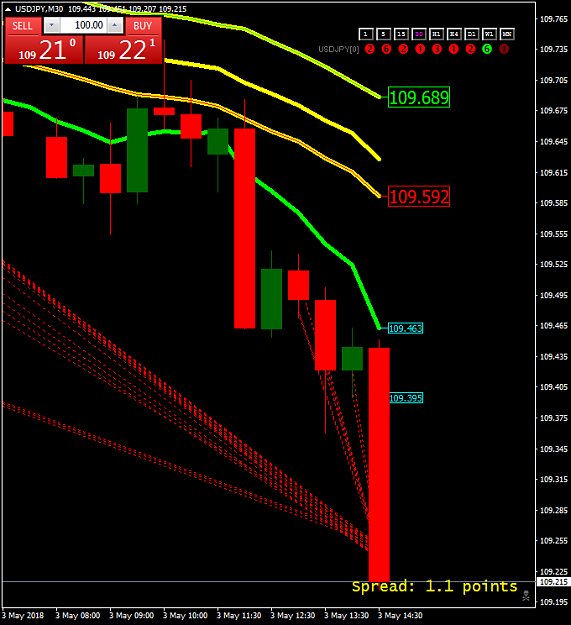
Sell breakout:
Enter short if price breakout and closes below the 34 ema low.
If short the Stoploss is 10 days high or a close above the center line.
when can we take profits?
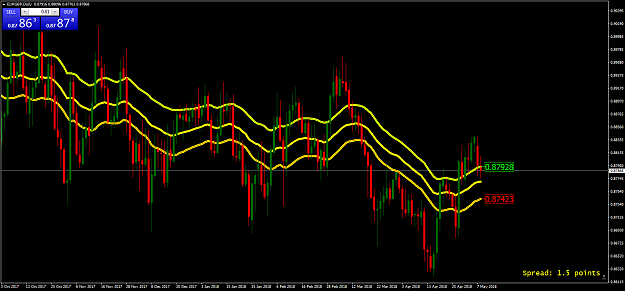
Buy breakout:
Buy market when the price breakout
and closes above the 34 ema high
If long the Stoploss is 10 days low or a close below the center line.
Where to take profits?
===========================================
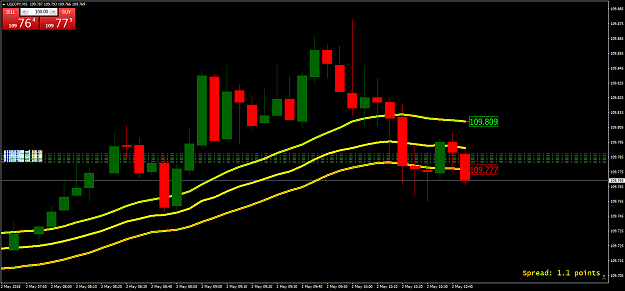
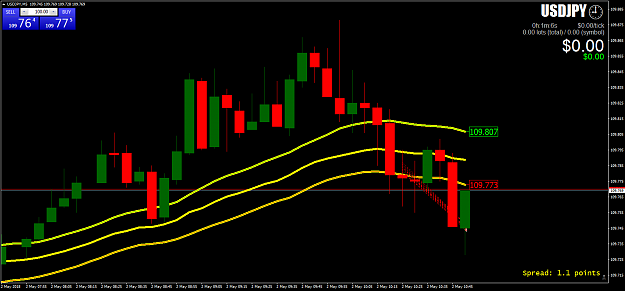
Sell breakout:
Enter short if price breakout and closes below the 34 ema low.
If short the Stoploss is 10 days high or a close above the center line.
when can we take profits?
Attached Image(s) (click to enlarge)