• Home
  • Forums
  • Trades
  • News
  • Calendar
  • Market
  • Brokers
  • Login
  • Join
  • User/Email: Password:
  • 2:12am
Menu
  • Forums
  • Trades
  • News
  • Calendar
  • Market
  • Brokers
  • Login
  • Join
  • 2:12am
Sister Sites
  • Metals Mine
  • Energy EXCH
  • Crypto Craft

Options

Bookmark Thread

First Page First Unread Last Page Last Post

Printable Version

Similar Threads

Looking for an Initial Balance indicator 4 replies

Best Strategy that always double my Initial balance weekly 4 replies

usa trade balance cad trade balance 6 replies

  • Trading Discussion
  • /
  • Reply to Thread
  • Subscribe
  • 18
Attachments: Initial Balance Range Trading
Exit Attachments

Initial Balance Range Trading

  • Last Post
  •  
  • Page 1 2
  • Page 1 2
  •  
  • Post #1
  • Quote
  • First Post: Edited at 9:21pm Mar 10, 2018 9:07pm | Edited at 9:21pm
  •  araa
  • Joined Apr 2014 | Status: Member | 185 Posts
Hello all,

I am starting this thread in a view to get more ideas about the trading setup I am going to show you. It is not a new concept but I believe it can offer good trading potential. Hence the reason why I am willing to put in the effort to share as much as I can in return for any great ideas that you may have in order to improve its performance. So please feel free to post anything that jogs your mind but please keep your suggestions within the scope of this discussion. Thanks in advance

FYI I am not an expert in any matter whatsoever and indeed I'm just an ordinary casual trader. So please forgive me if I err in my discussions.

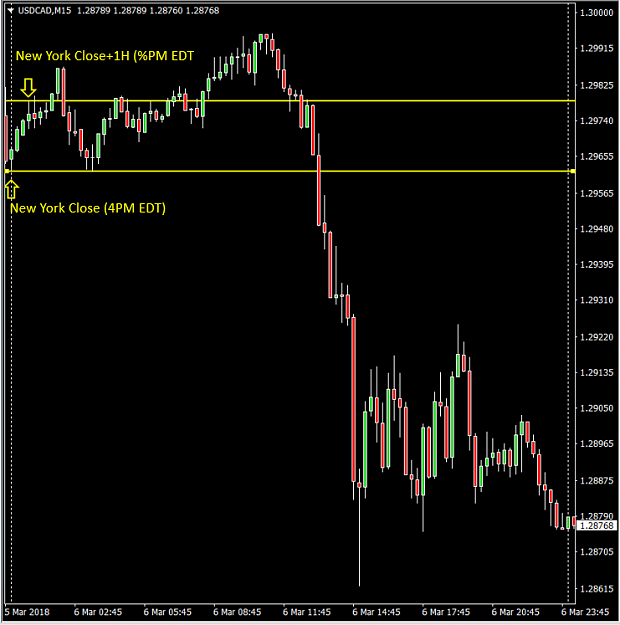
Ok let's get down to business. I will start off by describing the method very briefly in this first post and I will post further illustrations in subsequent posts. I will be talking about Initial Balance Range as applied to forex. To make things simple, I will define the Initial Balance Range (IBR) as the first hour of trading after New York close i.e. the first hour of a new trading day. As a reminder, New York Stock Exchange closes at 4 PM EDT (Eastern Daylight Time). Thus, the IBR will be defined between 4 PM and 5PM EDT.
Next we will draw the IBR levels which will be the Low and the High prices in that time range. We will then wait for price to break out of the IBR and then trade either the breakout on the candle break or wait for a pullback. The IBR can thus be used as an intraday support/resistance zone.

Here are my rules on trading the IBR:

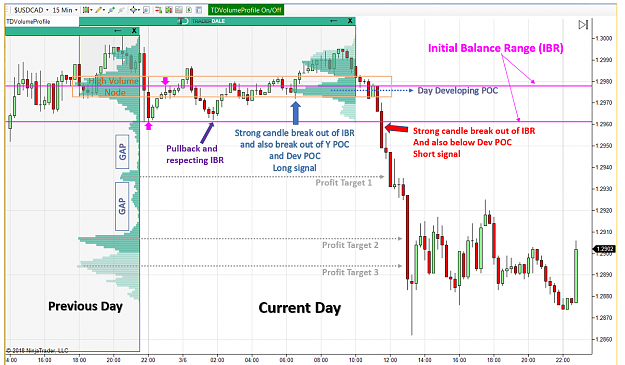
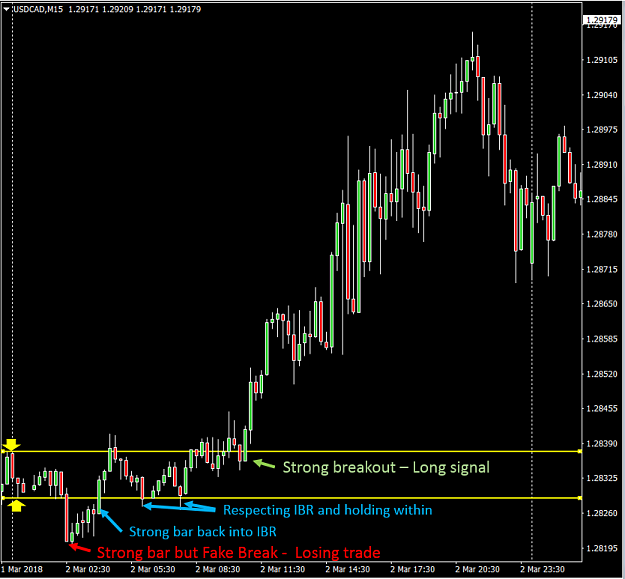
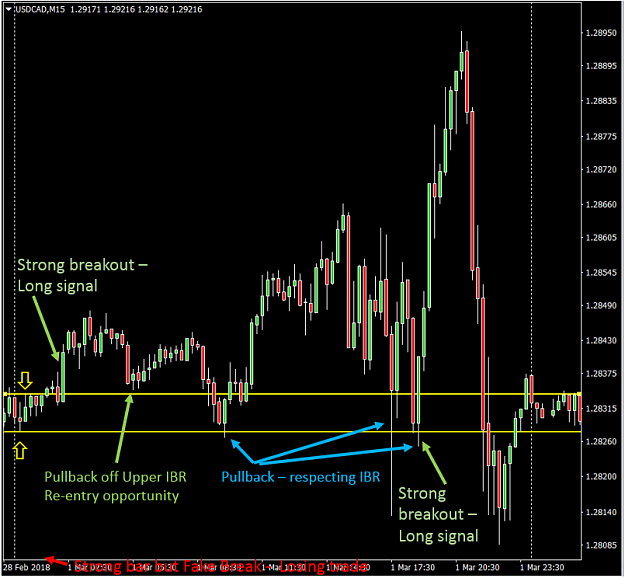
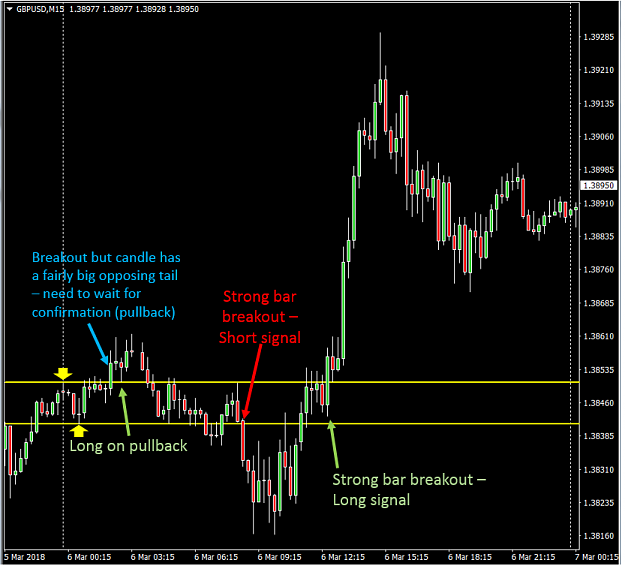
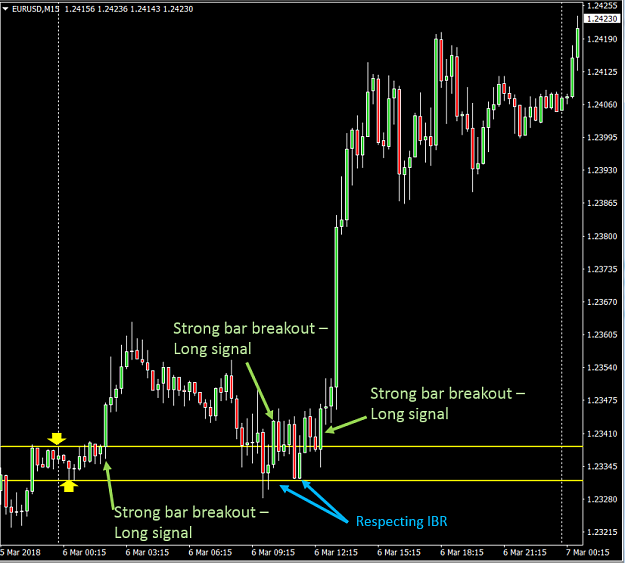
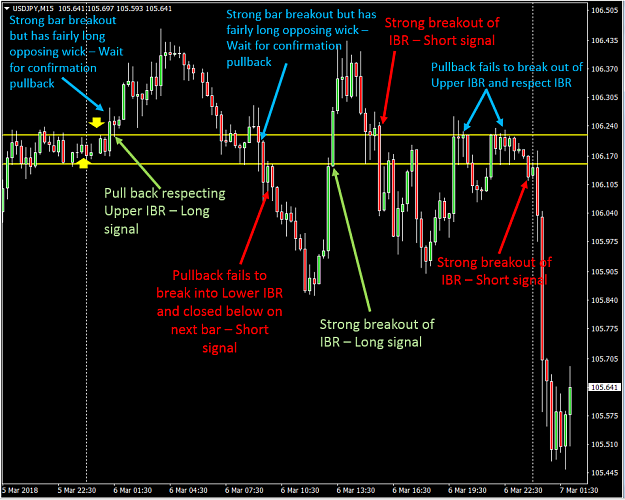
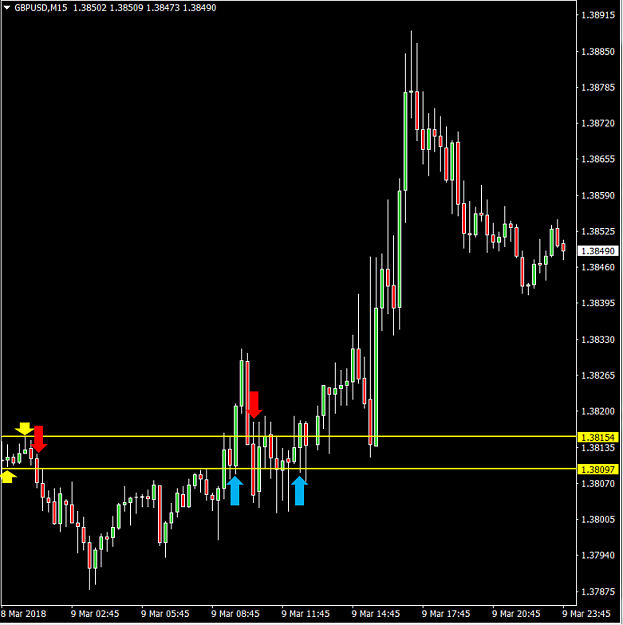
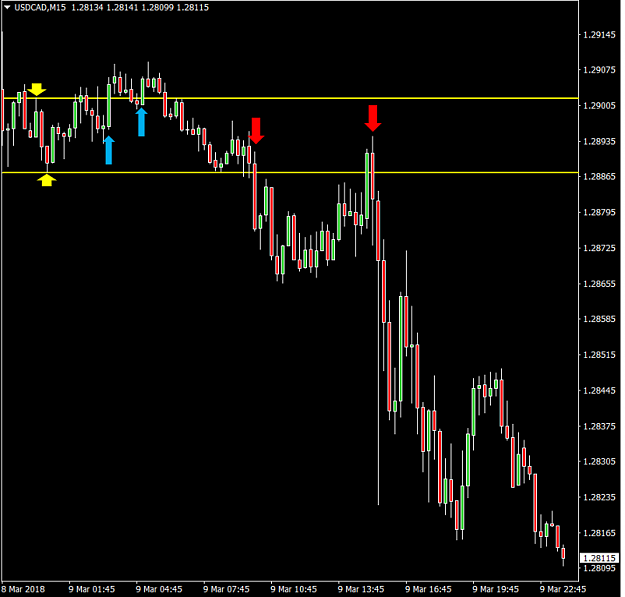
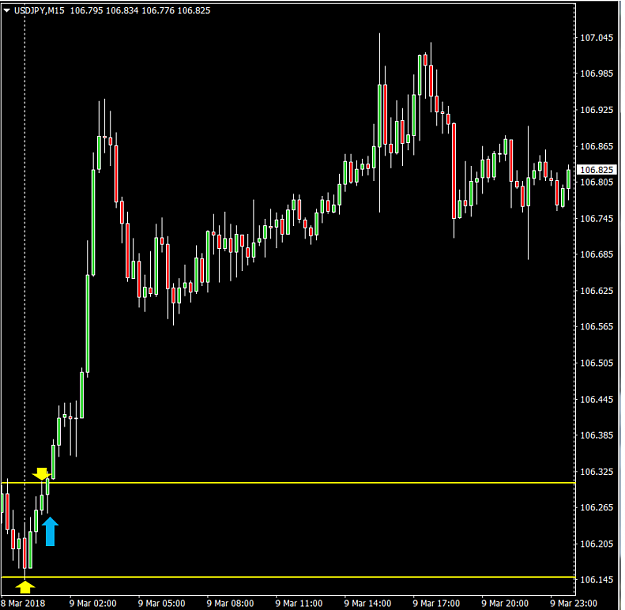
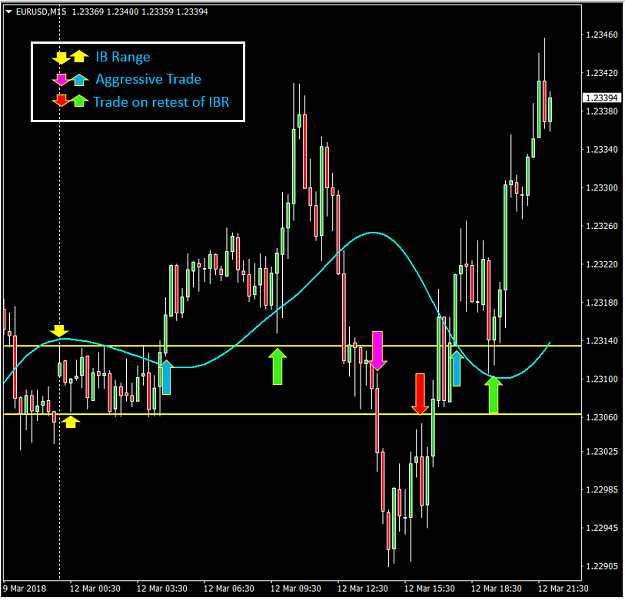
  1. I would usually take the trade on a strong candle breakout out of the IBR and set my stoploss at the the opposite end of the IBR. For example, I would go long on a strong candle break out of the Upper IBR and set my stoploss just below the Lower IBR
  2. To me, a strong candle means a candle with a big body with a small opposing tail. If the breakout candle has a fairly big opposing tail, then I would wait for a pullback to the IBR to take the trade.
  3. If the IBR range is too big, then I won’t trade it as my risk (stoploss) is often based on the size of the IBR range
  4. I will set my profit targets based on a number of factors but you can tailor it to your own preferences.
  5. I use Market Profile to increase confluence in my trading and also to set my profit targets. However, Market Profile is optional and I am not going into further detail on this. However if you wish to find out more there are many threads in FF that address this topic. The one I would personally recommend is the following:
  6. I trade on M15 timeframe

https://www.forexfactory.com/showthread.php?t=608433

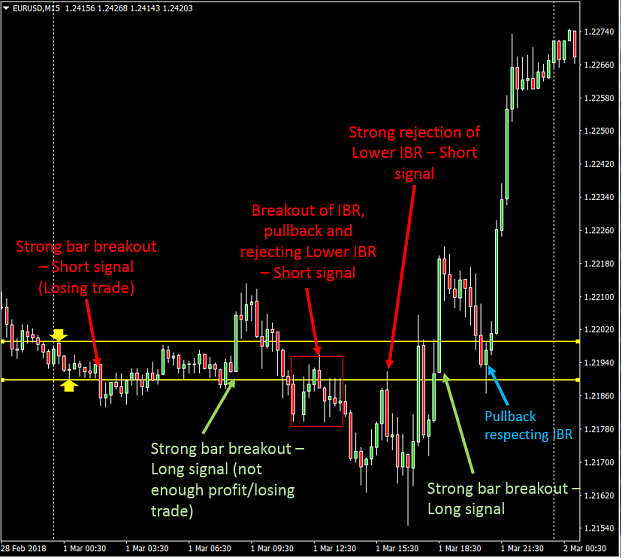
This proposed trading method does work most of the time but also gives a few fake signals. So there is definitely room for improvement here. Let's hope that you ladies and gents come up with some good suggestions and make this method more successful so that we can all benefit from it.

I will illustrate the method by means of a few trades that I took recently. I trade the major pairs, mainly USDCAD, USDJPY, EURUSD and GBPUSD. To keep things simple, I will not show Market Profile in the charts except for one. I trade on MT4 but uses Ninja Trader for my analysis.

  • Post #2
  • Quote
  • Mar 10, 2018 9:13pm Mar 10, 2018 9:13pm
  •  araa
  • Joined Apr 2014 | Status: Member | 185 Posts
Here is how the IBR is defined (levels within yellow lines). Note my broker time is not set to New York Time (EDT)
Attached Image (click to enlarge)
Click to Enlarge

Name: Screenshot3.png
Size: 89 KB
  • Post #3
  • Quote
  • Mar 10, 2018 9:16pm Mar 10, 2018 9:16pm
  •  araa
  • Joined Apr 2014 | Status: Member | 185 Posts
Now let me illustrate the full trade setup.
Attached Image (click to enlarge)
Click to Enlarge

Name: Screenshot2.png
Size: 204 KB
  • Post #4
  • Quote
  • Mar 10, 2018 9:18pm Mar 10, 2018 9:18pm
  •  araa
  • Joined Apr 2014 | Status: Member | 185 Posts
And a few more examples (without Market Profile)
Attached Image (click to enlarge)
Click to Enlarge

Name: Screenshot1.png
Size: 99 KB
  • Post #5
  • Quote
  • Mar 10, 2018 9:19pm Mar 10, 2018 9:19pm
  •  araa
  • Joined Apr 2014 | Status: Member | 185 Posts
USDCAD on 1st MArch 2018
Attached Image (click to enlarge)
Click to Enlarge

Name: Screenshot1.png
Size: 105 KB
  • Post #6
  • Quote
  • Mar 10, 2018 9:20pm Mar 10, 2018 9:20pm
  •  araa
  • Joined Apr 2014 | Status: Member | 185 Posts
GBPUSD on 6th March
Attached Image (click to enlarge)
Click to Enlarge

Name: Screenshot1.png
Size: 109 KB
  • Post #7
  • Quote
  • Mar 10, 2018 9:21pm Mar 10, 2018 9:21pm
  •  araa
  • Joined Apr 2014 | Status: Member | 185 Posts
EURUSD 6th March
Attached Image (click to enlarge)
Click to Enlarge

Name: Screenshot1.png
Size: 111 KB
  • Post #8
  • Quote
  • Mar 10, 2018 9:22pm Mar 10, 2018 9:22pm
  •  araa
  • Joined Apr 2014 | Status: Member | 185 Posts
EURUSD 1st March
Attached Image (click to enlarge)
Click to Enlarge

Name: Screenshot1.png
Size: 125 KB
1
  • Post #9
  • Quote
  • Mar 10, 2018 9:23pm Mar 10, 2018 9:23pm
  •  araa
  • Joined Apr 2014 | Status: Member | 185 Posts
USDJPY 6th March
Attached Image (click to enlarge)
Click to Enlarge

Name: Screenshot1.png
Size: 153 KB
  • Post #10
  • Quote
  • Mar 10, 2018 9:25pm Mar 10, 2018 9:25pm
  •  araa
  • Joined Apr 2014 | Status: Member | 185 Posts
Ok I have a more more trades but I am not going to show all of them. I hope that you have understood what I mean. My focus is on how to reduce the losing trades. Any good ideas are most welcome!
  • Post #11
  • Quote
  • Mar 10, 2018 9:35pm Mar 10, 2018 9:35pm
  •  araa
  • Joined Apr 2014 | Status: Member | 185 Posts
More recent trades Friday 9th March with huge potential
Attached Image (click to enlarge)
Click to Enlarge

Name: Screenshot1.png
Size: 74 KB
  • Post #12
  • Quote
  • Mar 10, 2018 9:39pm Mar 10, 2018 9:39pm
  •  araa
  • Joined Apr 2014 | Status: Member | 185 Posts
USDCAD 9th March
Attached Image (click to enlarge)
Click to Enlarge

Name: Screenshot1.png
Size: 78 KB
  • Post #13
  • Quote
  • Mar 10, 2018 9:43pm Mar 10, 2018 9:43pm
  •  araa
  • Joined Apr 2014 | Status: Member | 185 Posts
USDJPY 9th March with huge profit potential
Attached Image (click to enlarge)
Click to Enlarge

Name: Screenshot1.png
Size: 87 KB
  • Post #14
  • Quote
  • Edited at 6:26am Mar 11, 2018 5:48am | Edited at 6:26am
  •  marcmarc
  • Joined Feb 2010 | Status: Retired from the fray | 231 Posts
Hi araa,
Based on the examples you have provided above, if you simplified your entry method and just took each closing break beyond your IBR, you'd actually make more money fading the breaks than following them. This is because failed tests are by definition more likely in ranging market conditions, and markets tend to range more of the time than trend strongly. This is why you are having the fake signals experience you mention.

In conceptual terms, the way to make this kind of range break method work is to be able to identify better than randomly when a market breaks and trends strongly vs. when it is just testing a range and falls back again. One way of trying to achieve this is to look to trade the reaction to the test, rather than the test itself. You will on average get a less favourable entry point but a higher chance of being correct.

It's not the worst starting point for a strategy but it will need more refinement. Best of luck!
  • Post #15
  • Quote
  • Mar 12, 2018 5:15am Mar 12, 2018 5:15am
  •  araa
  • Joined Apr 2014 | Status: Member | 185 Posts
Quoting marcmarc
Disliked
Hi araa, Based on the examples you have provided above, if you simplified your entry method and just took each closing break beyond your IBR, you'd actually make more money fading the breaks than following them. This is because failed tests are by definition more likely in ranging market conditions, and markets tend to range more of the time than trend strongly. This is why you are having the fake signals experience you mention. In conceptual terms, the way to make this kind of range break method work is to be able to identify better than randomly...
Ignored
Thanks for your suggestions.
  • Post #16
  • Quote
  • Mar 12, 2018 8:42am Mar 12, 2018 8:42am
  •  guralnickkin
  • | Joined Mar 2018 | Status: Junior Member | 1 Post
What is the avg amount do you suggest to start an account with?
  • Post #17
  • Quote
  • Mar 12, 2018 2:09pm Mar 12, 2018 2:09pm
  •  araa
  • Joined Apr 2014 | Status: Member | 185 Posts
Quoting guralnickkin
Disliked
What is the avg amount do you suggest to start an account with?
Ignored
Hi
If you are referring to this method in particular, hold on as this is not ready yet.

The amount you need to start off with depends on a number of factors such as your margin requirements among others. You can use a open a micro (lot) account and start from there. It's hard for me to put a figure down but I guess a £500 with a leverage of say 200 on a micro account would suffice as a start.

Use the margin calculator to get an idea of the minimum account balance that needs to be maintained for a particular instrument/leverage during trading:
https://www.fxpro.co.uk/trading/calculators/margin#

Note for the above margin calculator: 1 standard lot = 100,000 units and 1 micro lot (i.e. 0.01 standard lot) = 1000 units
  • Post #18
  • Quote
  • Mar 12, 2018 3:06pm Mar 12, 2018 3:06pm
  •  araa
  • Joined Apr 2014 | Status: Member | 185 Posts
Adding some filtering in order to avoid the fake trades resulting in the initial ranging market. Added an MA.
Evaluating two types of trading: Aggressive (as in previous trades) and Trading on retest of IBR.

No losing trades with a minimum profit target of 10 pips
Attached Image (click to enlarge)
Click to Enlarge

Name: Screenshot1.png
Size: 119 KB
  • Post #19
  • Quote
  • Mar 12, 2018 3:07pm Mar 12, 2018 3:07pm
  •  araa
  • Joined Apr 2014 | Status: Member | 185 Posts
Profitable on GBPUSD with 2 wins and 1 loss
Attached Image (click to enlarge)
Click to Enlarge

Name: Screenshot1.png
Size: 108 KB
  • Post #20
  • Quote
  • Mar 12, 2018 3:12pm Mar 12, 2018 3:12pm
  •  araa
  • Joined Apr 2014 | Status: Member | 185 Posts
EURUSD
Agreesive way: 3 wins
Trade on retest: 2 wins and 1 loss
Attached Image (click to enlarge)
Click to Enlarge

Name: Screenshot1.png
Size: 96 KB
  • Trading Discussion
  • /
  • Initial Balance Range Trading
  • Reply to Thread
    • Page 1 2
    • Page 1 2
0 traders viewing now
  • More
Top of Page
  • Facebook
  • Twitter
About FF
  • Mission
  • Products
  • User Guide
  • Media Kit
  • Blog
  • Contact
FF Products
  • Forums
  • Trades
  • Calendar
  • News
  • Market
  • Brokers
  • Trade Explorer
FF Website
  • Homepage
  • Search
  • Members
  • Report a Bug
Follow FF
  • Facebook
  • Twitter

FF Sister Sites:

  • Metals Mine
  • Energy EXCH
  • Crypto Craft

Forex Factory® is a brand of Fair Economy, Inc.

Terms of Service / ©2021