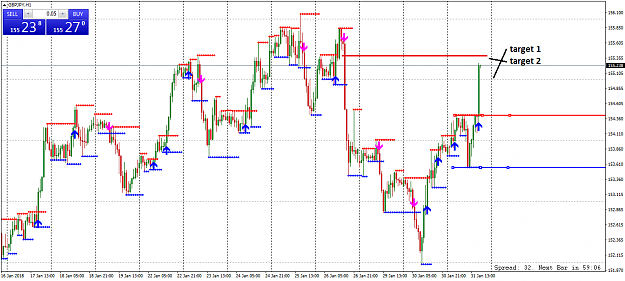
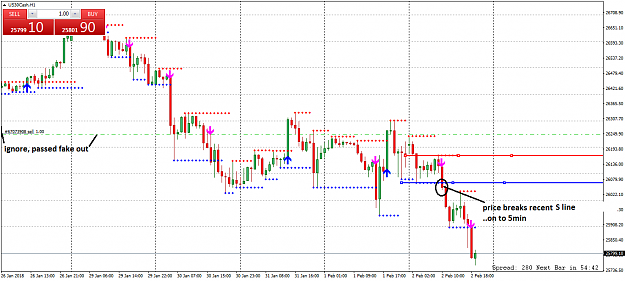
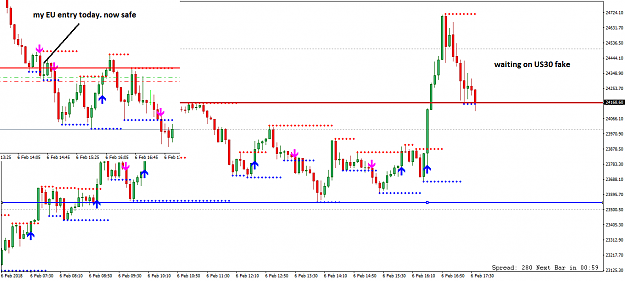
Yes you are using a pic a couple of hrs after mine so a new R has been formed (look at my 1hr pic again) it was the dotted lines under that one.
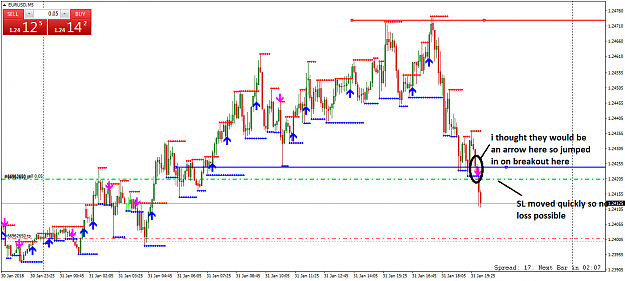
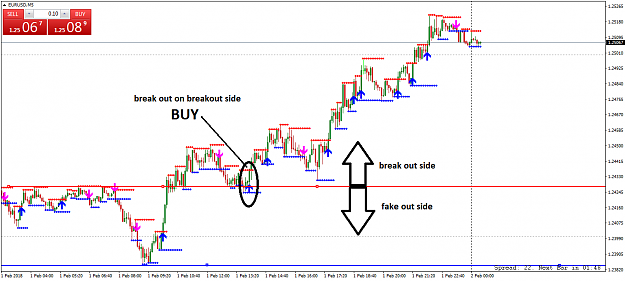
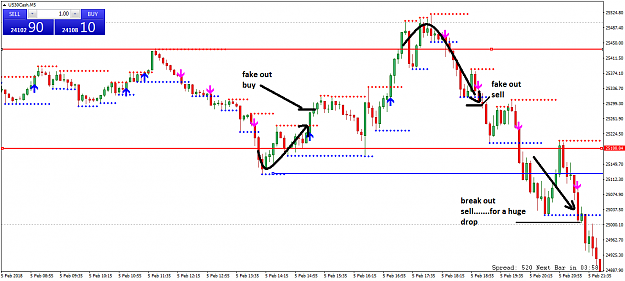
on the 5min price went through R and formed a high (which was not broken), then price came down through 5min resistance (the one you circled), meaning a fake out and buy
on the 5min price went through R and formed a high (which was not broken), then price came down through 5min resistance (the one you circled), meaning a fake out and buy