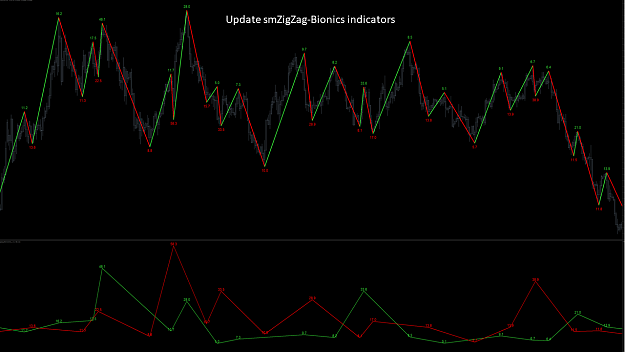
Update smZigZag-Bionics and smZigZag-Bionics Osc
Hello dear subscribers,
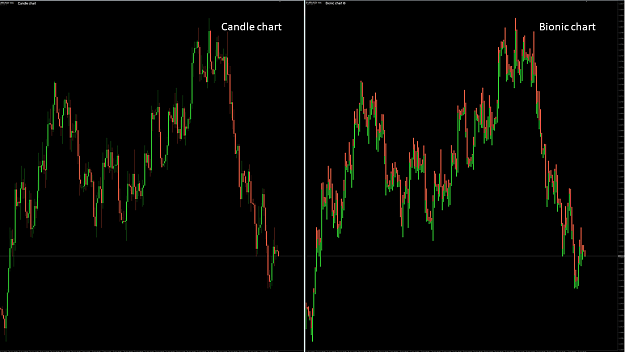
While our second project has already started, we are continuing to work on our first project. Both indicators of the first project have now been extended and should now run optimally. Let's look at the individual extensions.
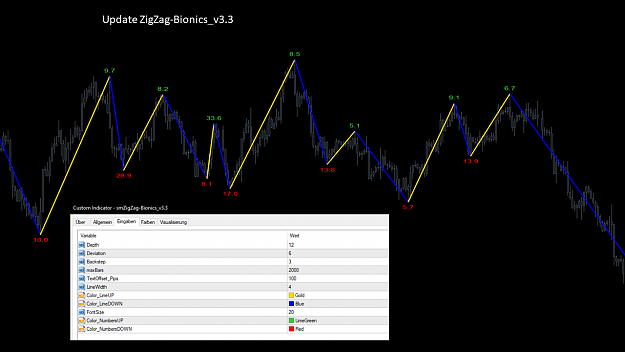
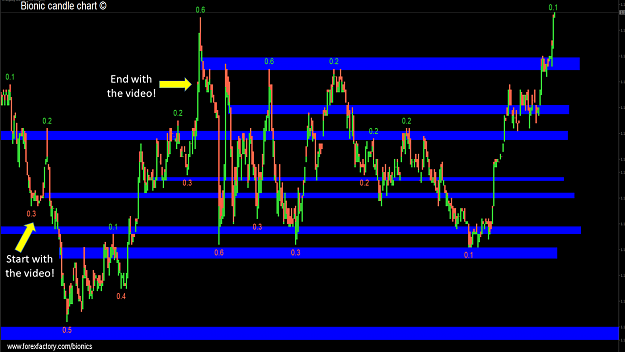
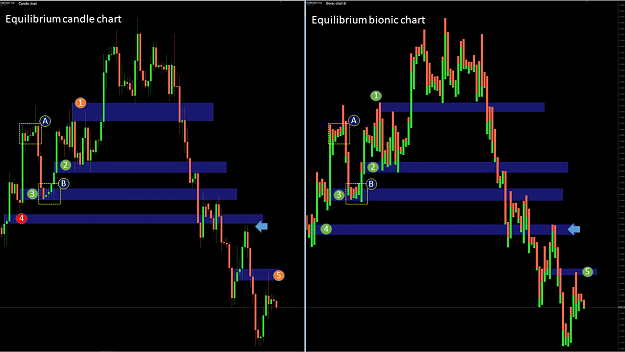
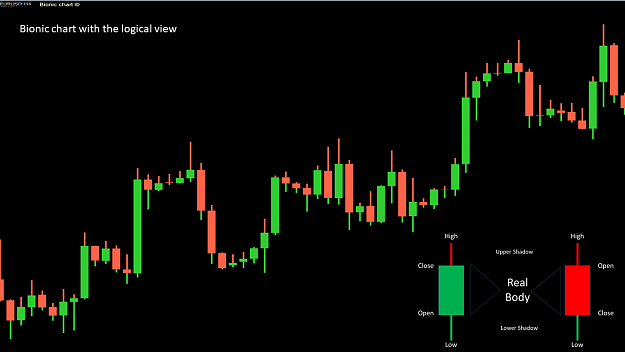
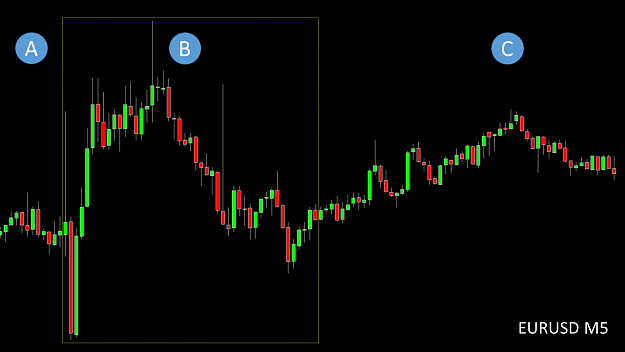
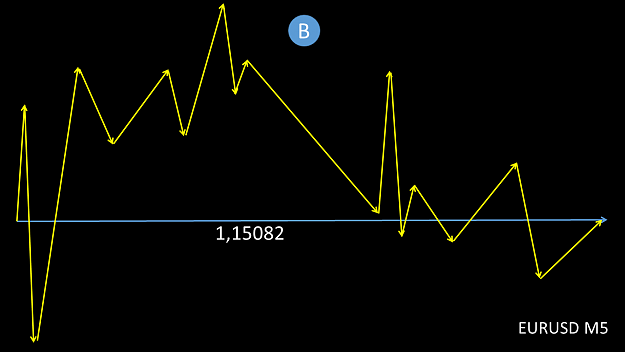
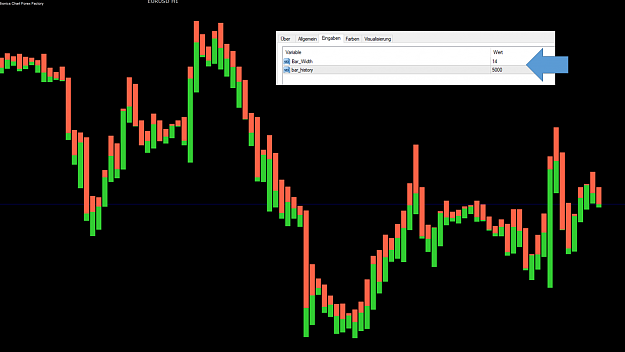
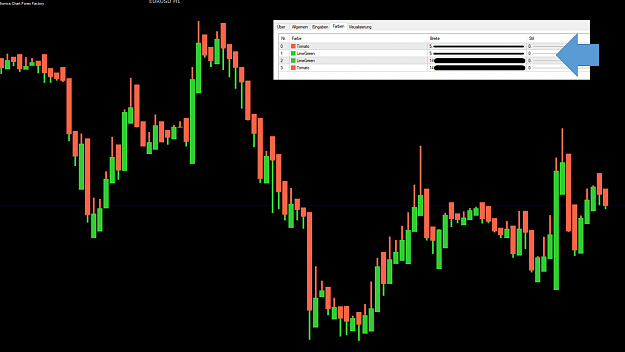
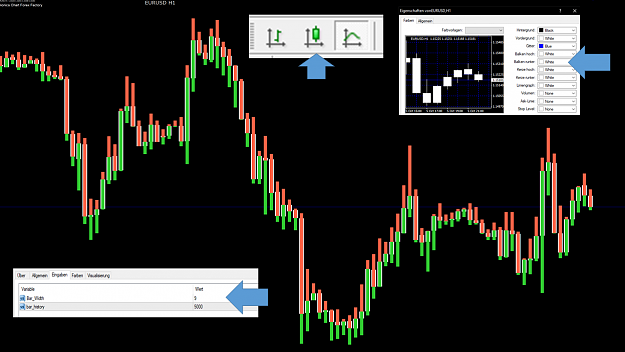
With the smZigZag-Bionics_v3.3 you are now able to assign individual colors to the lines as well as the numbers underneath, which, as you know, show the average Pip per Candle within a range. Now you can hide bullish / bearish numbers or lines and make only upward or downward trends visible. These qualities are needed for our second project. This indicator is very flexible so that you can use it as a pure ZigZag Color in case of doubt.
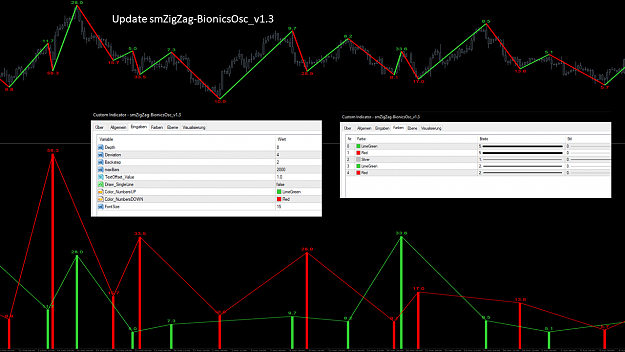
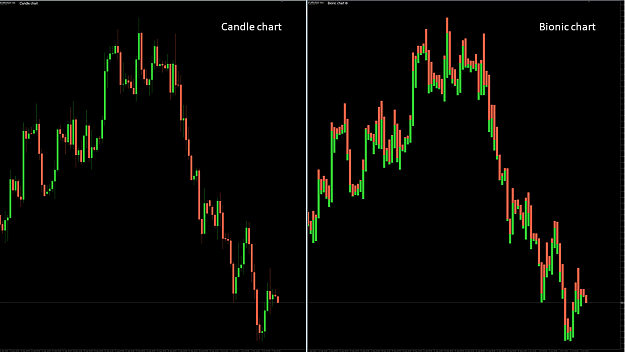
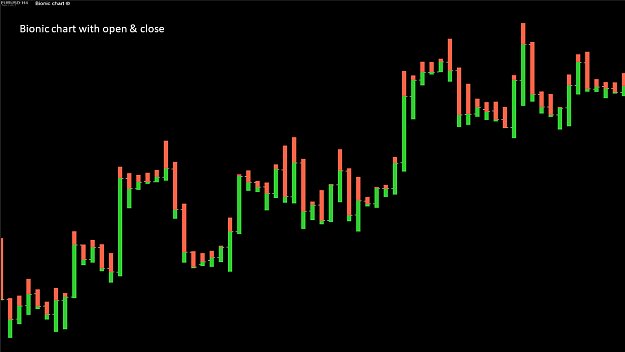
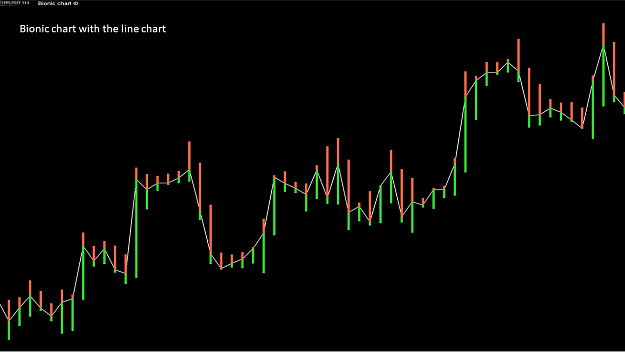
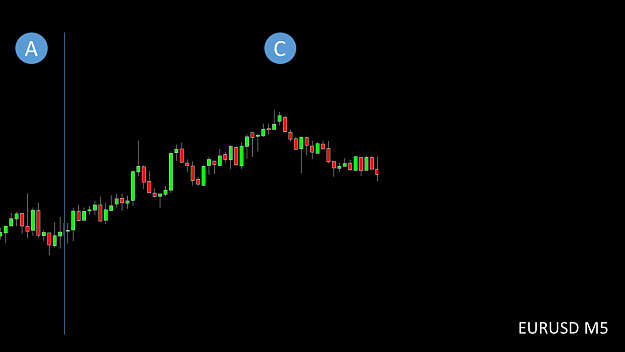
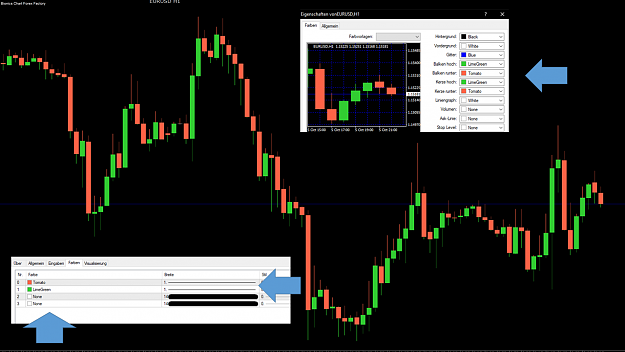
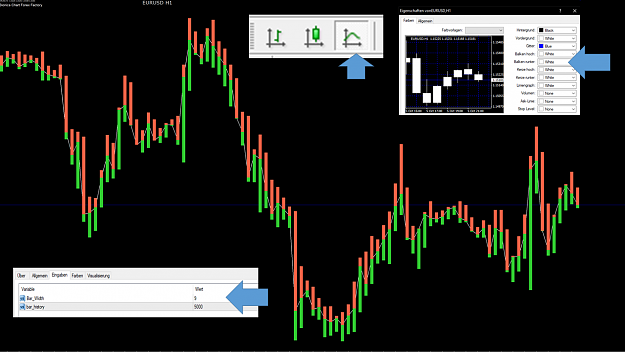
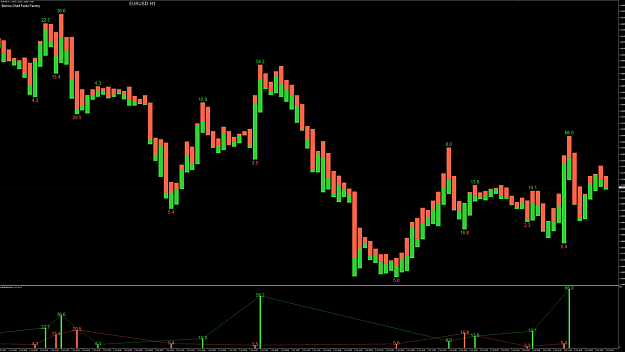
In addition, the smZigZagOsc_1.3 has been extended. It is now also possible to display only bearish lows or bullish highs. In addition, the highs / lows can be connected to a line. We can also use these properties very well in our second project.
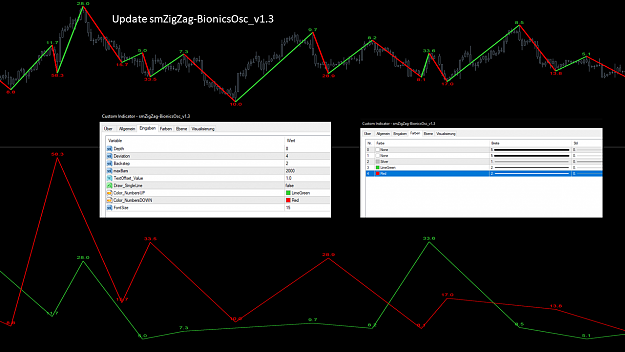
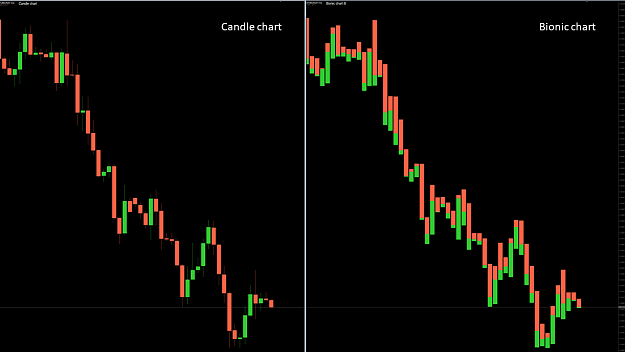
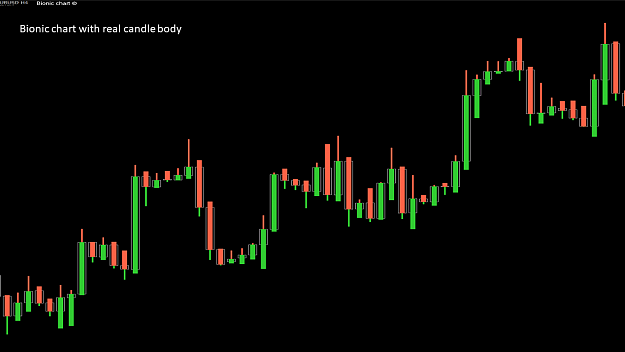
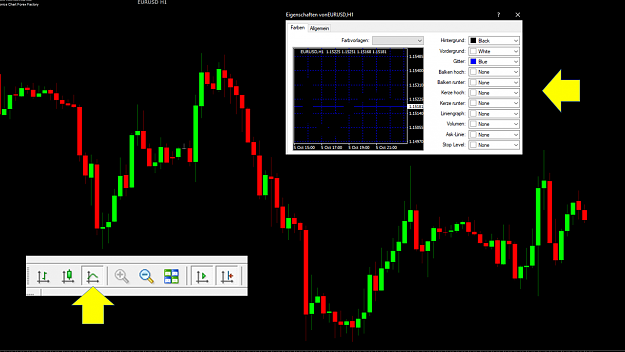
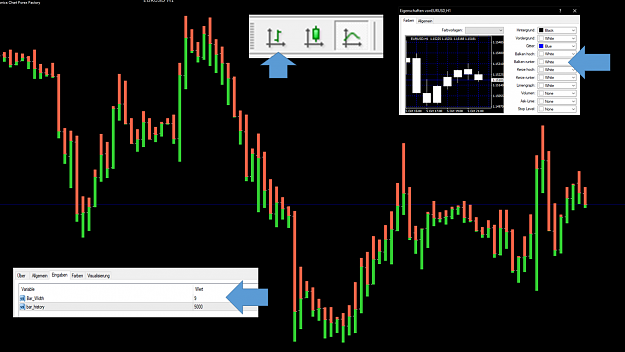
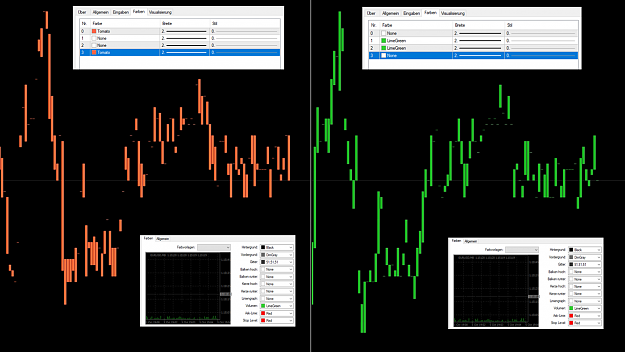
In this example I once hidden the bars. Thus, only the bearish low points and the bullish high points are connected. For this view, I had no time to make a concrete evaluation. I am convinced that we will make some interesting discoveries here.
The indicators would have to be ready so far now it is up to us to move forward in this project. That's why I'm still looking forward to your discoveries and contributions in the first project. The second project seamlessly follows the first project and supports the findings of the trend.
To summarize this once again:
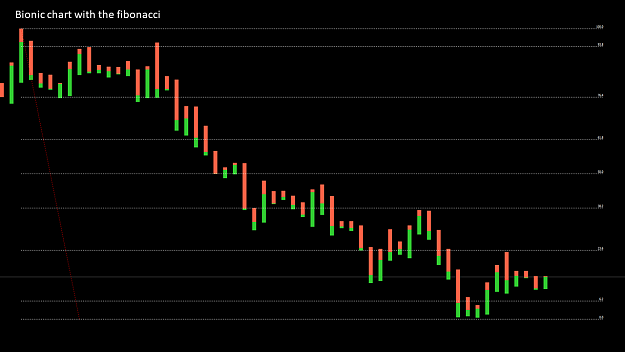
The main decision to trade is always based on your personal strategy. That could be Fibonacci, or the Moving Average in my case it is demand and supply.
Our project 1 serves only to determine a possible medium-term trend direction with a higher probability.
Our project 2 serves only to determine a possible short-term trend direction with a higher probability.
Example:
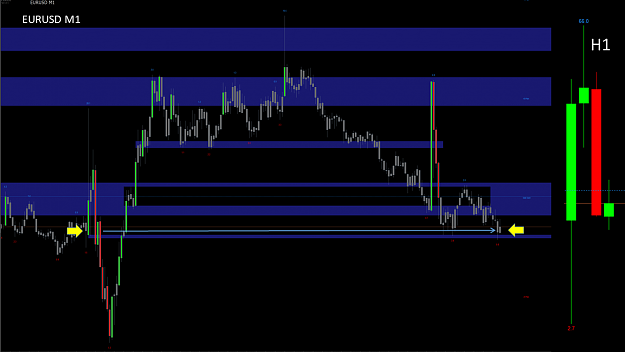
A trend is moving up and in my analysis, I have identified a resistance line. Now I compare my analysis with my project 1. This will tell me if it could be a sustainable trend or a pullback. Once the course reaches my drawn resistance level, I am able to make a very short-term trading decision with our Project 2.
However, the main decision is always based on my personal strategy of supply or demand. Only from Strategy 1 or Strategy 2 alone would I never make a trading decision. Therefore, the indicators I have developed are purely supportive indicators.
I have aligned these support indicators with my demand and supply principle in order to make even more accurate trading decisions. Since I do not act according to other strategies, I can not assess to what extent these support indicators are useful and relevant for you.
I wish you much success today
best regards
Hello dear subscribers,
Attached Image (click to enlarge)
While our second project has already started, we are continuing to work on our first project. Both indicators of the first project have now been extended and should now run optimally. Let's look at the individual extensions.
Attached Image (click to enlarge)
With the smZigZag-Bionics_v3.3 you are now able to assign individual colors to the lines as well as the numbers underneath, which, as you know, show the average Pip per Candle within a range. Now you can hide bullish / bearish numbers or lines and make only upward or downward trends visible. These qualities are needed for our second project. This indicator is very flexible so that you can use it as a pure ZigZag Color in case of doubt.
Attached Image (click to enlarge)
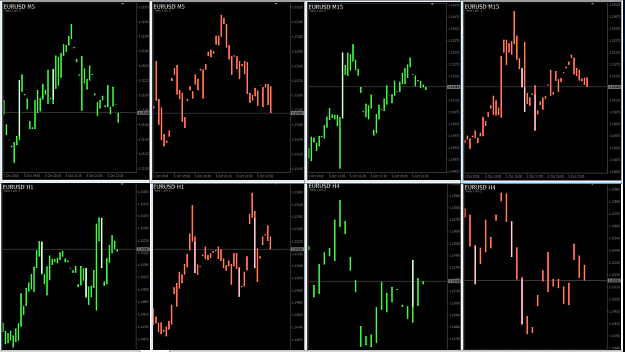
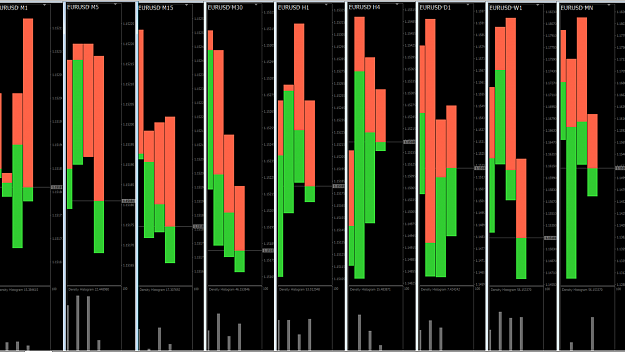
In addition, the smZigZagOsc_1.3 has been extended. It is now also possible to display only bearish lows or bullish highs. In addition, the highs / lows can be connected to a line. We can also use these properties very well in our second project.
Attached Image (click to enlarge)
In this example I once hidden the bars. Thus, only the bearish low points and the bullish high points are connected. For this view, I had no time to make a concrete evaluation. I am convinced that we will make some interesting discoveries here.
The indicators would have to be ready so far now it is up to us to move forward in this project. That's why I'm still looking forward to your discoveries and contributions in the first project. The second project seamlessly follows the first project and supports the findings of the trend.
To summarize this once again:
The main decision to trade is always based on your personal strategy. That could be Fibonacci, or the Moving Average in my case it is demand and supply.
Our project 1 serves only to determine a possible medium-term trend direction with a higher probability.
Our project 2 serves only to determine a possible short-term trend direction with a higher probability.
Example:
A trend is moving up and in my analysis, I have identified a resistance line. Now I compare my analysis with my project 1. This will tell me if it could be a sustainable trend or a pullback. Once the course reaches my drawn resistance level, I am able to make a very short-term trading decision with our Project 2.
However, the main decision is always based on my personal strategy of supply or demand. Only from Strategy 1 or Strategy 2 alone would I never make a trading decision. Therefore, the indicators I have developed are purely supportive indicators.
I have aligned these support indicators with my demand and supply principle in order to make even more accurate trading decisions. Since I do not act according to other strategies, I can not assess to what extent these support indicators are useful and relevant for you.
I wish you much success today
best regards
Attached File(s)
Attached File(s)
Forget:That does not work, amateurs build the ark, pros the Titanic!
4