NOTE: I don't visit FF so often now, so don't expect replies to your posts. You can find an index to all my indicators and posts here.
Daily high/low histogram indicator: Terms and Conditions
All code is supplied FREE of charge. It may NOT be sold or distributed commercially. Unless otherwise shown, no source code is available.
Software is offered on an 'as is' basis. I'm not offering a programming or troubleshooting service.
There is no guarantee that the software is fit for purpose, or free of errors. Download and use the indicator(s) at your own risk; I accept no liability for computer damage or financial losses.
___________________________
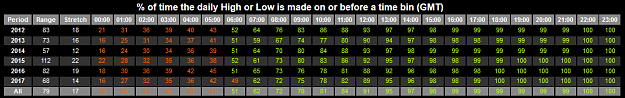
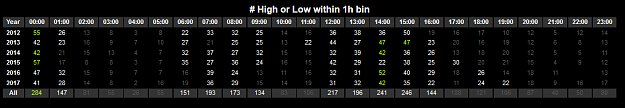
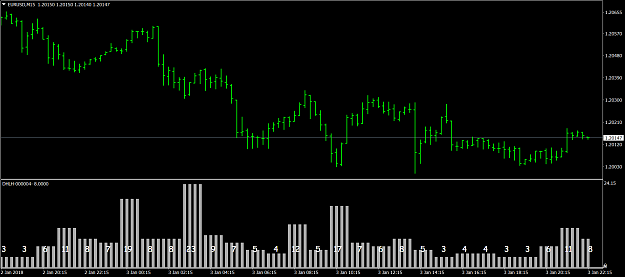
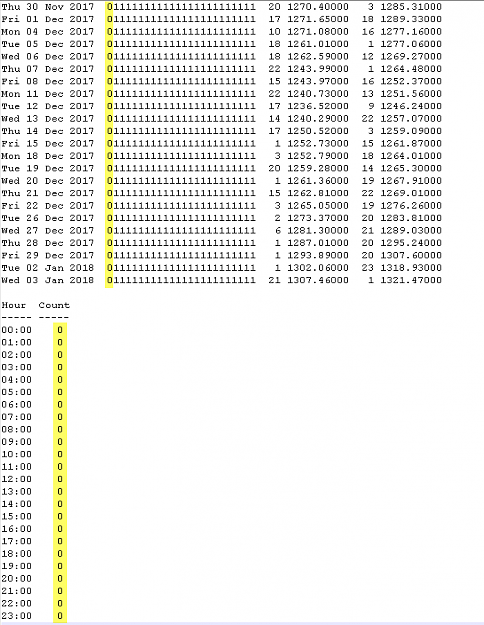
I've finally decided to share this indicator publicly. It's not a holy grail; it simply is what it is. It looks back over as much H1 price history as you specify, ascertains during which hour(s) of the day (00-23 MT4 time) the daily high and low occurred -- both the high and low add 1 to the count for each hour -- and then plots a frequency histogram in a new chart sub-window. It's designed to work best on a M15 (or shorter TF) chart. See screenshot: 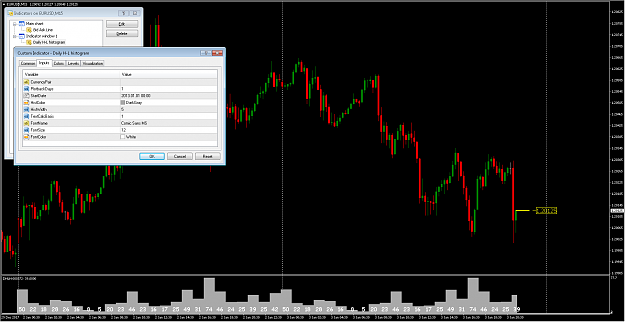
The indicator is designed to work on the 28 major currency pairs; using it on exotics, metals, indices, cryptocurrencies, etc may cause unpredictable results.
If you leave CurrencyPair blank, it defaults to the current chart's instrument.
PlotbackDays is the number of days backwards from the current date that you want the histogram to be plotted. (Obviously the same size histogram bar gets plotted for the same time each day) .
StartDate is the date from which you want the history to be searched. The earlier this date, the longer the indicator takes to perform the necessary calculation, before the histogram is initially plotted.
A numeric value can also optionally be plotted above each histogram bar. TextCalcBasis determines what this value is, as follows:
0 = histogram bars only; no values (text) will be plotted
1 = the actual number of highs or lows that occurred during each hour will be printed
2 = the number of highs/lows will be converted to a percentage, for example a value of 167 means that a high or low occurred during this hour 16.7% of the time (the decimal point is omitted to save space)
3 = the hour during which the greatest number of highs/lows occurred is set to 100, and the other values are scaled proportionally, and then rounded to the nearest whole number
Press Ctrl-Y to toggle the day separators (vertical dotted lines) on/off.
NOTE: This indicator was written using MetaEditor/compiler build 509. If you want the .mq4 source to compile/run without errors, you'll need to do this first. Otherwise, download only the .ex4 file.
Daily high/low histogram indicator: Terms and Conditions
All code is supplied FREE of charge. It may NOT be sold or distributed commercially. Unless otherwise shown, no source code is available.
Software is offered on an 'as is' basis. I'm not offering a programming or troubleshooting service.
There is no guarantee that the software is fit for purpose, or free of errors. Download and use the indicator(s) at your own risk; I accept no liability for computer damage or financial losses.
___________________________
I've finally decided to share this indicator publicly. It's not a holy grail; it simply is what it is. It looks back over as much H1 price history as you specify, ascertains during which hour(s) of the day (00-23 MT4 time) the daily high and low occurred -- both the high and low add 1 to the count for each hour -- and then plots a frequency histogram in a new chart sub-window. It's designed to work best on a M15 (or shorter TF) chart. See screenshot:
Attached Image (click to enlarge)
The indicator is designed to work on the 28 major currency pairs; using it on exotics, metals, indices, cryptocurrencies, etc may cause unpredictable results.
If you leave CurrencyPair blank, it defaults to the current chart's instrument.
PlotbackDays is the number of days backwards from the current date that you want the histogram to be plotted. (Obviously the same size histogram bar gets plotted for the same time each day) .
StartDate is the date from which you want the history to be searched. The earlier this date, the longer the indicator takes to perform the necessary calculation, before the histogram is initially plotted.
A numeric value can also optionally be plotted above each histogram bar. TextCalcBasis determines what this value is, as follows:
0 = histogram bars only; no values (text) will be plotted
1 = the actual number of highs or lows that occurred during each hour will be printed
2 = the number of highs/lows will be converted to a percentage, for example a value of 167 means that a high or low occurred during this hour 16.7% of the time (the decimal point is omitted to save space)
3 = the hour during which the greatest number of highs/lows occurred is set to 100, and the other values are scaled proportionally, and then rounded to the nearest whole number
Press Ctrl-Y to toggle the day separators (vertical dotted lines) on/off.
Attached File(s)
Attached File(s)