• Home
  • Forums
  • Trades
  • News
  • Calendar
  • Market
  • Brokers
  • Login
  • Join
  • User/Email: Password:
  • 2:54pm
Menu
  • Forums
  • Trades
  • News
  • Calendar
  • Market
  • Brokers
  • Login
  • Join
  • 2:54pm
Sister Sites
  • Metals Mine
  • Energy EXCH
  • Crypto Craft

Options

Bookmark Thread

First Page First Unread Last Page Last Post

Print Thread

Similar Threads

Double Top, Double Bottom Fallacy 11 replies

M&W (double top/bottom) indicators? 0 replies

Double Top or Bottom Expert Advisor 8 replies

Double top or bottom indicator in mt4 4 replies

Need help for this very very simple indicator 0 replies

  • Commercial Content
  • /
  • Reply to Thread
  • Subscribe
  • 742
Attachments: FREE Double Top/Bottom Indicator - Very Good Edge
Exit Attachments

FREE Double Top/Bottom Indicator - Very Good Edge

  • Last Post
  •  
  • Page 1 23456 24
  • Page 1 234 24
  •  
  • Post #1
  • Quote
  • First Post: Edited Dec 21, 2017 2:58pm Nov 10, 2017 10:06am | Edited Dec 21, 2017 2:58pm
  •  FX-Mike
  • | Commercial Member | Joined Apr 2017 | 395 Posts
New video added with a forward test! You will see that the signals are coming in real-time.

Hello,

my name is Mike Semlitsch. I’m the owner of www.PerfectTrendSystem.com and a professional software developer who trades since more than 10 years.

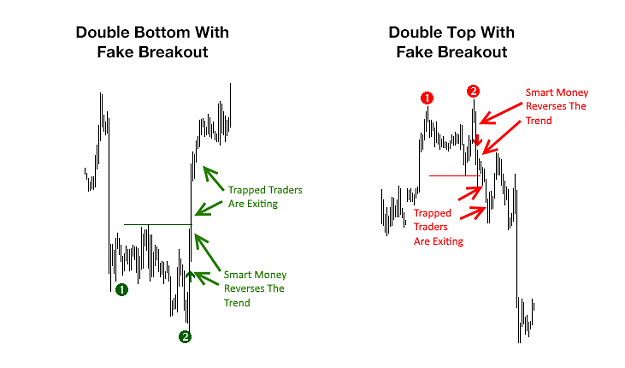
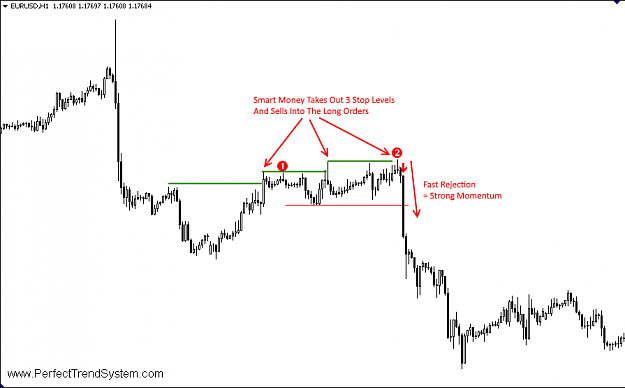
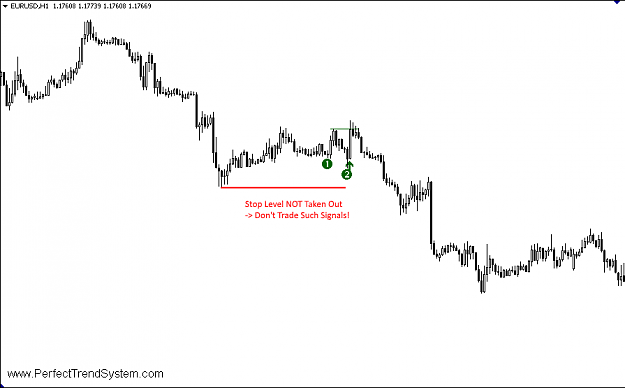
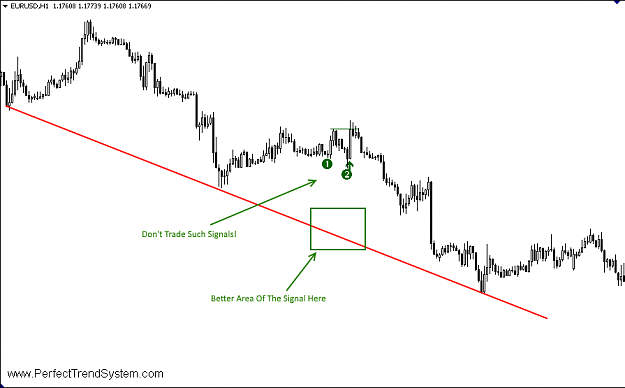
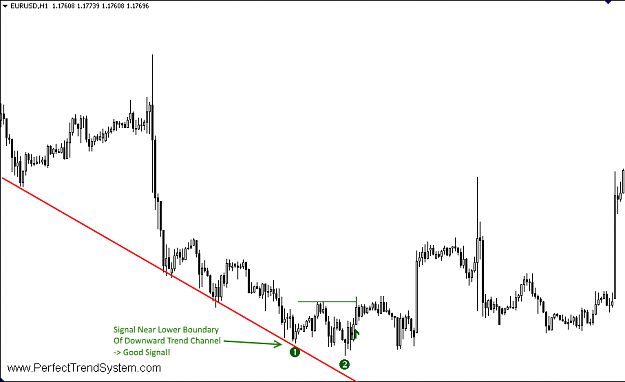
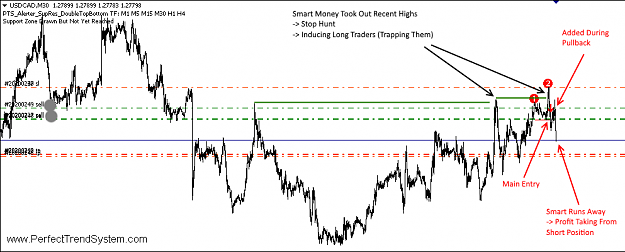
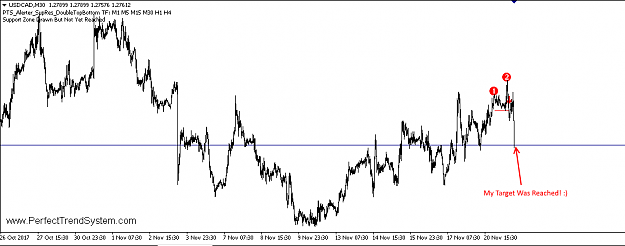
I can proudly present a very good Double Top/Bottom indicator which gives you a good edge over the market and which is based on sound trading logic (as you will see later).

You can get the indicator here for FREE:
http://www.perfecttrendsystem.com/do...ttom-indicator

The following video shows the great potential of this indicator. The 35 trades in the video had a theoretical performance of 128% profit with 2% risk per trade.

With theoretical performance, I mean that this could have been the profit if you would have exited every trade at the optimal price level. Of course, this can’t be achieved during real trading conditions where you don’t know future price moves.

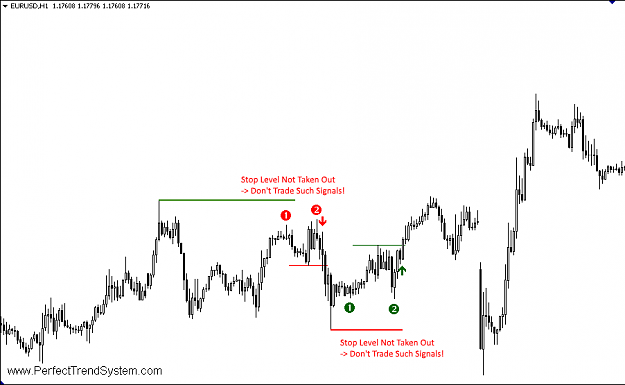
But the video shows that the raw signals of the indicator (without visual filtering) produced 24 winning trades and only 11 losing trades. In the video, I count a trade as a winning trade if it reaches at least 1R profit (1R = initial risk of the trade). So, these raw signals would be already very profitable if you place the target for all trades at 1R and then leave the trade alone, without trying to find the optimal exit.

Please watch the video (BTW: this indicator does NOT repaint):
Inserted Video
  • Post #2
  • Quote
  • Nov 10, 2017 10:06am Nov 10, 2017 10:06am
  •  FX-Mike
  • | Commercial Member | Joined Apr 2017 | 395 Posts

Why is this indicator so profitable?


As I mentioned above, this indicator is based on sound trading logic. It exploits the always recurring behavior of the smart money (in forex the mega banks). The smart money produces double tops and bottoms with fake breakouts. Then the smart money reverses the trend very sharply.

The following screenshots are showing a double bottom and a double top with fake breakout:

Attached Image (click to enlarge)
Click to Enlarge

Name: 1_Double_Top_Bottom_Fake_Breakout_real_chart.png
Size: 11 KB


The fake breakout is the move behind the left leg (labeled with 1) followed by a sharp reversal. With this pattern, the smart money makes a final accumulation of its position before it reverses the trend.

This is a recurring behavior which you can exploit!
 
 
  • Post #3
  • Quote
  • Edited at 4:28pm Nov 10, 2017 10:07am | Edited at 4:28pm
  •  FX-Mike
  • | Commercial Member | Joined Apr 2017 | 395 Posts

Why does this pattern happen?


The forex market has at its core the interbank market. It’s a network between the mega banks Citicorp, JP Morgan Chase; Deutsche Bank, HSBC etc. All smaller networks are attached to the interbank market. The 8 biggest mega banks are responsible for 70% of volume which is traded in the forex market every day. These mega banks are the smart money and the driving forces in the forex market.

If we look at the huge volume of the 8 biggest banks then we can agree that the forex game is more or less a battle between 8 big market participants (the smart money) and millions of smaller market participants (the herd). You can guess who will win the fight every day.

Every buyer needs a seller and every seller needs a buyer. This means that for every position that is taken in the forex market there needs to be a counter part of this position.

Now let’s assume that most members of the herd jump on a trend when it starts to develop, they enter on pullbacks or scalp during fast moves in direction of the trend etc. Most members of the herd seek trends and want to profit from them.

If this is true, then an imbalance within the herd will develop during trends. This means e.g. during an upward trend the herd will throw more long orders than short orders into the market. During a downward trend the herd will throw more short orders into the market than long orders.

So, what happens with this imbalance? Who takes the counterpart of the imbalance of millions of market participants? It’s the smart money (the mega banks). The smart money is therefore taking positions against the direction of the prevailing trend.

Lately I heard that the mega banks are NOT charity organizations. They are indeed acting in the markets to make profits for themselves. What a shock! So, what do the mega banks do if they take positions against the direction of the trend and their entire position is in a deep drawdown?

They need to drive their position into profit and give the position back to the herd (of course with profit)! And this special action of the mega banks is detected by the Double Top/Bottom Indicator!

The following charts show what I mean with the explanations above. The smart money takes the imbalance of the herd and therefore must take the position against the trend. The average price of the position of the smart money is in loss at this moment:

Attached Image (click to enlarge)
Click to Enlarge

Name: 2_Imbalance_AVG_price.png
Size: 21 KB


The position of the smart money is in loss. And for whatever reason, the smart money decides that NOW is a good time to reverse the trend and to drive its position into profit again. But as you can see in the charts above the average price of the position of the smart money is far away from the actual price and maybe they want to accumulate an even bigger position before they reverse the trend to make even more profits.

Therefore, the smart money decides to drive the price into the next liquidity zone where stops of the herd are placed and where new entries of the herd in direction of the trend can be expected. Such liquidity zones are directly below the recent low (in a downward trend) and above the recent high (in an upward trend).

Following charts show those liquidity zone:

Attached Image (click to enlarge)
Click to Enlarge

Name: 3_Liquidity_From_Herd.png
Size: 10 KB


As soon as the liquidity zones are reached the smart money starts aggressively adding to its position. Through this aggressive adding to its position the average price of the position of the smart money comes nearer to the actual price, as shown in the following charts:

Attached Image (click to enlarge)
Click to Enlarge

Name: 4_Liquidity_From_Herd_With_ActionsSmartMoney.png
Size: 23 KB


Within the liquidity zones the smart money absorbs all incoming orders from the herd. As soon as the smart money has accumulated a big enough position it reverses the trend very sharply. The trapped traders of the herd who opened their position within the liquidity zones into the wrong direction are now in panic and exit or even reverse their position, as shown in following chart:

Attached Image (click to enlarge)
Click to Enlarge

Name: 5_Final_Reversal.png
Size: 26 KB


This is what happens in the markets every day, not only in the forex market.

And this pattern is detected by the Double Top/Bottom Indicator which you can get for FREE.

Maybe the explanations above “why this happens” sound too esoteric for you. And I can’t proof them. But what I definitely know is that if you start thinking based on these concepts then great things can happen to your trading. Then you start seeing price moves and patterns from a complete different angle.
 
 
  • Post #4
  • Quote
  • Nov 10, 2017 10:07am Nov 10, 2017 10:07am
  •  FX-Mike
  • | Commercial Member | Joined Apr 2017 | 395 Posts

Visual Filtering


To get an even better performance you shouldn’t take every signal of the indicator!

Besides the look of the signal itself (how obvious is the fake breakout and the sharp reversal?) you should also look where the signal occurs.

The big picture analysis (where the signal occurs) imho can’t be programmed into a fixed programmatic ruleset. Or at least a visual filtering is a lot better than a programmatic attempt. Therefore, I prefer a visual check for every signal.

How to visually check?

With the explanations above about the smart money in mind you can ask yourself the following questions:

For Double Bottoms
Is the double bottom signal at a low (did the smart money most probably accumulate a long position)?
Is there enough room to the upside for a good Risk/Reward? This means: Is the next resistance far enough away?

For Double Tops
Is the double top signal at a high (did the smart money most probably accumulate a short position)?
Is there enough room to the downside for a good Risk/Reward? This means: Is the next support far enough away?

Later I can add more details to this part, if necessary.
 
 
  • Post #5
  • Quote
  • Edited at 10:23am Nov 10, 2017 10:08am | Edited at 10:23am
  •  FX-Mike
  • | Commercial Member | Joined Apr 2017 | 395 Posts

Tips


I personally use the timeframes M30 and higher. They have less noise and you have usually more time to react. But of course, it’s up to you which timeframes you want to trade. There are good signals on every timeframe.

Feel free to ask me any questions about the usage of this indicator / trading style.

Wish you a lot of pips and happy trading!

PS:
I know from my own experience that nobody can scan all trading instruments and timeframes without missing some of these good setups. Therefore, I have created an Alerter-Tool which checks up to 30 instruments and 8 timeframes for you. This tool is available for a small one-time-fee here:
Double Top/Bottom Alerter
 
 
  • Post #6
  • Quote
  • Nov 10, 2017 10:36am Nov 10, 2017 10:36am
  •  FX-Mike
  • | Commercial Member | Joined Apr 2017 | 395 Posts
Today were good trades on GBPCAD and EURGBP:

Attached Image (click to enlarge)
Click to Enlarge

Name: Screenshot2.png
Size: 17 KB


Attached Image (click to enlarge)
Click to Enlarge

Name: Screenshot3.png
Size: 19 KB
 
 
  • Post #7
  • Quote
  • Nov 11, 2017 12:35am Nov 11, 2017 12:35am
  •  rammer13
  • | Joined Apr 2015 | Status: Member | 139 Posts
Hi have requested your free indicator will get back to you later Cheers !!!
 
 
  • Post #8
  • Quote
  • Nov 11, 2017 3:17am Nov 11, 2017 3:17am
  •  FX-Mike
  • | Commercial Member | Joined Apr 2017 | 395 Posts
Quoting rammer13
Disliked
Hi have requested your free indicator will get back to you later Cheers !!!
Ignored
Great

During the weekend you can also do visual backtests in the strategy tester:

Attached Image (click to enlarge)
Click to Enlarge

Name: Screenshot2.png
Size: 16 KB


Then you will see that this indicator doesn't repaint and gives the signals in realtime
 
 
  • Post #9
  • Quote
  • Edited at 7:32am Nov 13, 2017 7:22am | Edited at 7:32am
  •  FX-Mike
  • | Commercial Member | Joined Apr 2017 | 395 Posts
Today's short trade on USDCHF M30:

indicated by the FREE indicator:
Attached Image (click to enlarge)
Click to Enlarge

Name: Screenshot1.png
Size: 22 KB


alerted with the Alerting-Tool in real-time via email:
http://www.perfecttrendsystem.com/do...bottom-alerter
Attached Image (click to enlarge)
Click to Enlarge

Name: Screenshot3.png
Size: 4 KB


This pair also gave a nice trade on Thursday on H1:

Attached Image (click to enlarge)
Click to Enlarge

Name: Screenshot2.png
Size: 20 KB
 
 
  • Post #10
  • Quote
  • Nov 13, 2017 6:52pm Nov 13, 2017 6:52pm
  •  Ced74
  • Joined Jul 2013 | Status: Member | 2,881 Posts
Morning,
I have tried to use this indicator on several broker accounts and different time frames but all I get is notice of" Wrong Account"
Regards,
R
Aussie Battler
 
 
  • Post #11
  • Quote
  • Nov 14, 2017 3:42am Nov 14, 2017 3:42am
  •  FX-Mike
  • | Commercial Member | Joined Apr 2017 | 395 Posts
Quoting Ced74
Disliked
Morning, I have tried to use this indicator on several broker accounts and different time frames but all I get is notice of" Wrong Account" Regards, R
Ignored
Hi R,

the indicator can be used on different accounts but the indicator is bound to one account number per day until 0 GMT. At 0 GMT the account number is reset on the server side. After the reset you can use the indicator on a different account.

Example: Today you use the indicator on account 111. At 0 GMT the server resets the account. Tomorrow you can use it on any other account number e.g. 222

Quick solution for you:
If you want to use it on different accounts then you can simply request multiple copies of the indicator. Each copy can run on a different account.

Here is the link to the download page:
http://www.perfecttrendsystem.com/do...ttom-indicator
 
 
  • Post #12
  • Quote
  • Nov 16, 2017 9:01am Nov 16, 2017 9:01am
  •  FX-Mike
  • | Commercial Member | Joined Apr 2017 | 395 Posts
Hello,

a big thank you to the more than 150 users of the Double Top/Bottom Indicator and of course thanks to all who bought the Double Top/Bottom Alerter. With the Alerter you will never miss the setups again.

I really enjoyed the good feedback and the lively conversations via Email

Besides the good feedback, the following question was asked most often:
Is there a way to further add to the profitability of the signals?

And the answer is:
Yes! You need to be selective which signals you choose.

So, how can you be more selective? As I mentioned in Post #4 (Visual Filtering) there are two areas where you can improve the profitability of the signals:

1. The smaller picture and the look of the Double Top/Bottom itself (for a higher winning percentage)
2. The bigger picture analysis (for bigger winning trades)

I will start with the smaller picture and how a good Double Top/Bottom should look like. Later I will post some tips how you can use a bigger picture analysis with which you can get very big winners on a regular basis.


Filter #1: The smaller picture and the look of the Double Top/Bottom itself


A good Double Top/Bottom should take out a recent Top/Bottom followed by a fast rejection. The fast rejection shows the strong momentum of the move. The strong momentum is a sign that the smart money has most probably finished its accumulation phase and starts its profit release phase (the big move).

Examples of good Double Tops/Bottoms with stop levels taken out:

Recent high is taken out, then fast rejection downward:
Attached Image (click to enlarge)
Click to Enlarge

Name: 1_DoubleTopWithStopHunt.png
Size: 37 KB


Recent low is taken out, then fast rejection upward:
Attached Image (click to enlarge)
Click to Enlarge

Name: 2_DoubleBottomWithStopHunt.png
Size: 31 KB


Trend continuation trade, but multiple recent (smaller) highs are taken out:
Attached Image (click to enlarge)
Click to Enlarge

Name: 3_DoubleTopMultipleAccumulations.png
Size: 26 KB


Example of a bad Double Bottom:

Bad Double Bottom -> no recent low is taken out:
Attached Image (click to enlarge)
Click to Enlarge

Name: 4_DoubleBottomNoTrade.png
Size: 11 KB


Bad Double Bottom -> signal is not at the lower boundary of the trend channel:
Attached Image (click to enlarge)
Click to Enlarge

Name: 5_DoubleBottomNoTrade2.png
Size: 29 KB


Example of a good Double Bottom near lower boundary of the channel of the downward trend:

Attached Image (click to enlarge)
Click to Enlarge

Name: 6_DoubleBottomNearChannel.png
Size: 31 KB


Example of a bad Double Top/Bottom:

No recent high/low are taken out. Signals are not within a trend / near outer boundary of channel. Although both signals reached 1R you should not trade such signals:
Attached Image (click to enlarge)
Click to Enlarge

Name: 7_DTDB_NoTrade.png
Size: 28 KB
 
 
  • Post #13
  • Quote
  • Nov 20, 2017 6:23am Nov 20, 2017 6:23am
  •  FX-Mike
  • | Commercial Member | Joined Apr 2017 | 395 Posts

Filter #2: The bigger picture analysis


The following screenshot shows what i bigger picture analysis. This screenshot shows major support/resistance zones on the daily timeframe.

Often the direction of the trend will reverse within these areas. Now imagine how big your winners can get if you catch the reversal of the trend (e.g. the trend changes from downward trend to upward trend) near to the lowest point of the downward trend with a double bottom signal on the timeframe M30. You will have a tiny stop of e.g. 30 pips and a huge profit potential of several hundred pips!

Attached Image (click to enlarge)
Click to Enlarge

Name: majorSupRes.png
Size: 22 KB


This is professional trading with multiple edges:

Edge #1: High probability double bottom signal on lower TF
Edge #2: The big picture (the major support) adds to the quality of the signal of the lower TF

Soon I will release an Alerter-Tool with which you can trade exactly this trading style with major support/resistance zones. This Alerter-Tool will give you signals of all configured timeframes within the support/resistance zones.
 
1
  • Post #14
  • Quote
  • Nov 20, 2017 1:13pm Nov 20, 2017 1:13pm
  •  FX-Mike
  • | Commercial Member | Joined Apr 2017 | 395 Posts
As I said in the previous post. Double bottoms within major Support zones can get big. Today was a double bottom within a major support on USDJPY on M15:

Attached Image (click to enlarge)
Click to Enlarge

Name: Screenshot1.png
Size: 19 KB
 
1
  • Post #15
  • Quote
  • Edited at 10:10am Nov 21, 2017 5:31am | Edited at 10:10am
  •  FX-Mike
  • | Commercial Member | Joined Apr 2017 | 395 Posts
Double Top on USDCAD on M30 could get a good trade:

Attached Image (click to enlarge)
Click to Enlarge

Name: Screenshot1.png
Size: 22 KB


Alerted in real-time with the Double Top/Bottom Alerter
 
1
  • Post #16
  • Quote
  • Nov 21, 2017 8:57am Nov 21, 2017 8:57am
  •  FX-Mike
  • | Commercial Member | Joined Apr 2017 | 395 Posts
I love such good feedback in my inbox. Thank you Gary

Attached Image
 
 
  • Post #17
  • Quote
  • Nov 21, 2017 10:02am Nov 21, 2017 10:02am
  •  FX-Mike
  • | Commercial Member | Joined Apr 2017 | 395 Posts
Nice winning trade from my Live Call some hours ago!

Smart Money trapped long traders and hunted stops of short traders. Then the smart money runs away very fast to start its profit release phase:

Attached Image (click to enlarge)
Click to Enlarge

Name: USDCAD_2.png
Size: 42 KB


My targets were reached very fast:

Attached Image (click to enlarge)
Click to Enlarge

Name: USDCAD_3.png
Size: 17 KB


1.5 R winning trade. Pair this with a high winning percentage then ...
 
1
  • Post #18
  • Quote
  • Nov 21, 2017 10:59am Nov 21, 2017 10:59am
  •  ozziedave
  • Joined May 2007 | Status: Ozziedave | 1,661 Posts
Does the indy repaint the 1,2 numbers on the double tops and double bottoms?
 
 
  • Post #19
  • Quote
  • Nov 21, 2017 11:02am Nov 21, 2017 11:02am
  •  FX-Mike
  • | Commercial Member | Joined Apr 2017 | 395 Posts
Hi Ozzie,

no, it doesn't repaint.

Because the indicator waits for the break of the neckline it doesn't need to guess the left and right leg. After the neckline is reached the double top/bottom is completed. No further price action can change that completed reversal pattern.
 
 
  • Post #20
  • Quote
  • Nov 21, 2017 11:19am Nov 21, 2017 11:19am
  •  thecambist
  • | Joined Jul 2009 | Status: Member | 68 Posts
Quoting FX-Mike
Disliked
Hi Ozzie, no, it doesn't repaint. Because the indicator waits for the break of the neckline it doesn't need to guess the left and right leg. After the neckline is reached the double top/bottom is completed. No further price action can change that completed reversal pattern.
Ignored
So that means we are late to the party?

If the neckline ist already broken before the indicator shows up, we cant put in any limit orders in advance, correct?
 
 
  • Commercial Content
  • /
  • FREE Double Top/Bottom Indicator - Very Good Edge
  • Reply to Thread
    • Page 1 23456 24
    • Page 1 234 24
0 traders viewing now
  • More
Top of Page
  • Facebook
  • Twitter
About FF
  • Mission
  • Products
  • User Guide
  • Media Kit
  • Blog
  • Contact
FF Products
  • Forums
  • Trades
  • Calendar
  • News
  • Market
  • Brokers
  • Trade Explorer
FF Website
  • Homepage
  • Search
  • Members
  • Report a Bug
Follow FF
  • Facebook
  • Twitter

FF Sister Sites:

  • Metals Mine
  • Energy EXCH
  • Crypto Craft

Forex Factory® is a brand of Fair Economy, Inc.

Terms of Service / ©2022