Hi All
I have been working hard, trying to get a better understanding of reading price, and learning to SEE beyond the candles
I did some analysis this morning of my thoughts on some recent price action on the EUR USD chart (daily)
I would love your input, maybe we could ALL use this as a learning opportunity...
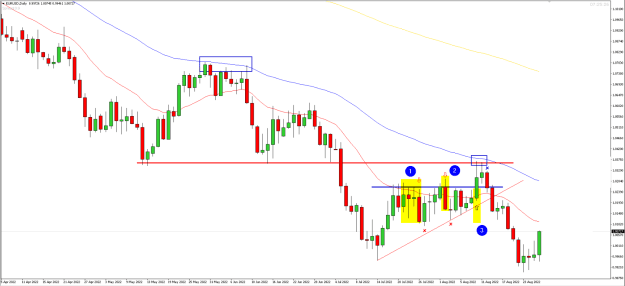
Attached Image (click to enlarge)
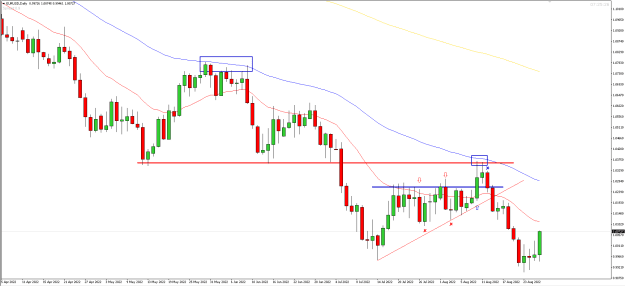
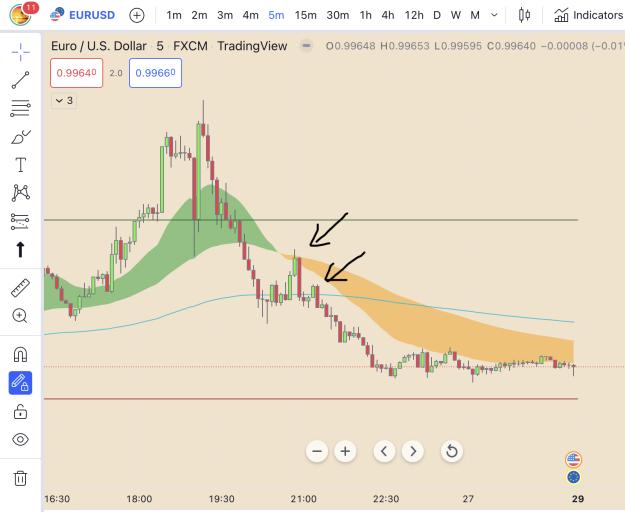
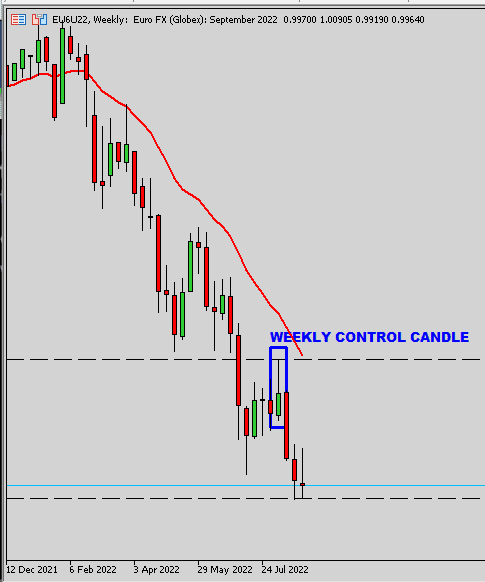
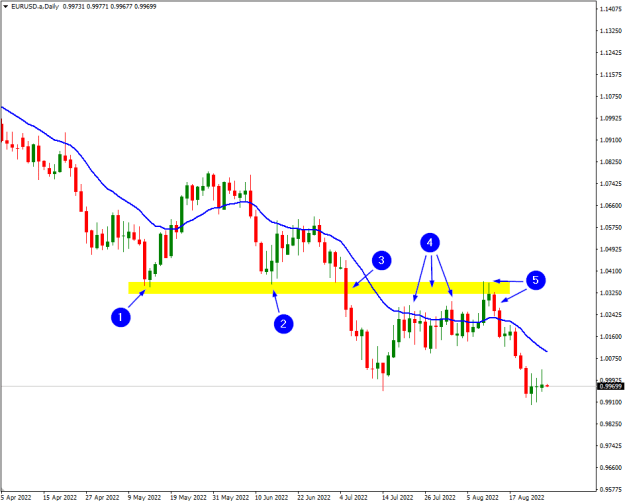
- Price hits support, counter trend traders come in here, and go long with there stop losses placed below the swing low
- Price forms a double bottom, more counter trend traders accumulate with long positions, stop losses below the swing low at a similar point to (1)
- Price eventually breaks to the downside taking out the stop losses of the long traders from points 1 & 2. There would also be a large amount of sell stop orders here, for traders shorting the break out. All of this supply results in a large red candle. There is most likely still a big accumulation of sell orders at the breakout for those short traders who never got filled on the break out.
- This is visible to us whenever price returns to the supply area at (4) we see upper wicks/ rejection over and over again, whenever price attempts to penetrate the supply
- Eventually price breaks higher where it is met by more short orders (this is at about the price of the breakout) finally filling some of those traders who never got filled initially. Eventually We get price action in the form of a BEEB which is our opportunity to go short with a very low risk trade in the direction of the overall trend and a bunch of supply above us
Note point 5 could also be seen by some as a liquidity sweep by the big boys wanting to go short. This a different theory to the one described above however both are seen as bearish... (which is fine by us) ![]()