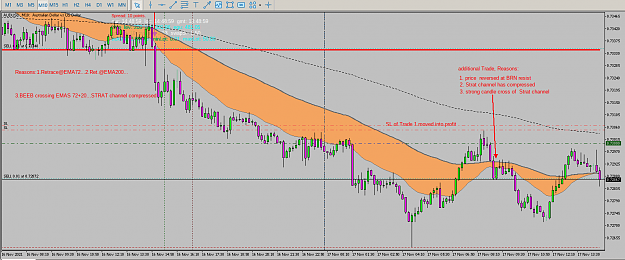
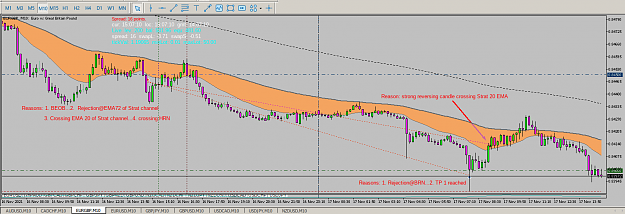
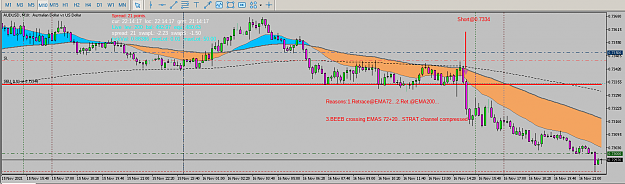
AUDUSD SHORT M10
Hey traders, took it 15:00 MEZ.... 34 pips so far....trade still running.....
greetings
doerpn
Hey traders, took it 15:00 MEZ.... 34 pips so far....trade still running.....
greetings
doerpn
Have a nice day
MY PASR journey Based on Strat's PASR Trading 76 replies
M5 PASR Trend Trading Strat 95 replies
My PASR Trend Trading Journals 3 replies
A young trader's road to profitability - PASR trading - Live 11 replies
Fibs trading and PASR 0 replies
DislikedAUDUSD SHORT M10 Hey traders, took it 15:00 MEZ.... 34 pips so far....trade still running..... {image} greetings doerpnIgnored
DislikedI noted that I would not be considering shorting EU since there was limited downside potential if the existing WCC was taken out. That was my opinion but the market will do what it wants to do so in this case, the most recent H4 straddle was the trigger that took out the bottom of the WCC. My impression was that there was support on the Boss and BB level from March 2020 but price just sliced through that level. Looking back now it seems that this level was not very strong if we look at the way price moved up through it in July 2020. So that bear...Ignored
Disliked{quote} QUESTIONS REGARDING ATR INDICATOR Hey traders, may I ask 2 questions regarding ATR(10) which most of you show in your screens....? 1. In which way do you use it? How is it integrated in your trading? I suppose its used to determine the most recent volatility for stop setting...to not set the stop too tight or large, right? For example you calculate the ATR x 2 or ATR x 3 for SL? In which as strat teaches this method trades from support to resistance and from resistance to support for me it is much more logical to set the SL below support...Ignored
Disliked{quote} Used for stop setting as you mention . And could also be used for target setting. I like confluence ... so as you describe setting SL below support, but also look to compare that with the ATR . If they coincide ... all the better. You then have 2 methods to confirm your SL placement. 10 trading days in 2 weeks.Ignored
Disliked{quote} Ah, okay...thanks LOU... So...if trading H4....it had to be 6x5x2=ATR(60)....? Always looking back 2 weeks or adapting higher timeframes..?Ignored
Disliked{quote} Hey Lou, I suppose have not expressed clearly enough....i know that ATR(10) always calculates the last 10 candles...but don`t see the whole purpose of ATR if trading M1 for example...which is 10 Minutes look back...mmhhmm. Thus thought if maybe adapting higher timeframes to longer ATR number makes sense...?Ignored
Disliked{quote} The example of the 1 minute chart was an explanation of what ATR does, not a suggestion. Strat's use of the ATR 10 and the Strat Shadow ema's is based on years of experience. As I recall he even had a researcher working with him and that person's findings caused the the change from 60 ema to 72 ema.Ignored
DislikedNo follow through on the first or second bull straddle Both bear straddles yielded Watch price action following the formation of the straddles for clues. {image}Ignored
Disliked{quote} With reference to the weekly chart, the 2 vertical lines indicated the location of the 2 failed bull straddle candles. The weekly trend is clearly down. So the appearance of the long bullish candles had given a chance for those who are holding long to liquidate their position at higher price. My understanding is to refer to the higher time frame when ever we see a long straddle candle. My one cent opinion. Corinna {image}Ignored