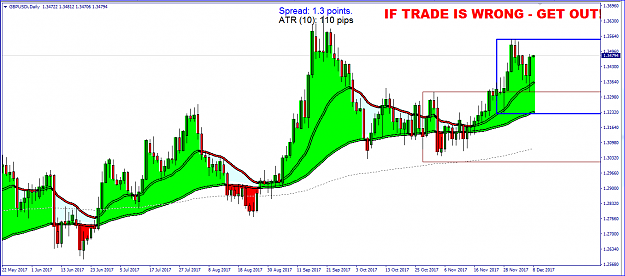
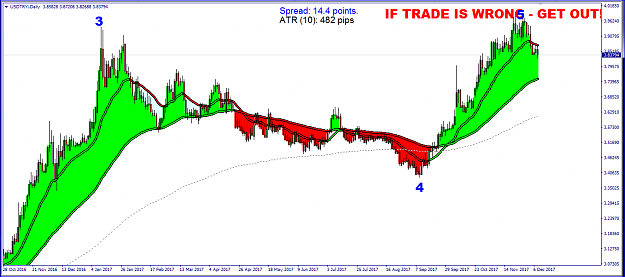
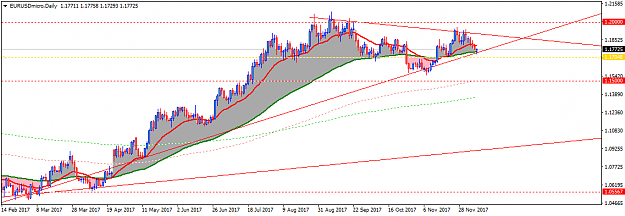
DislikedCOMPLETE PASR {quote} This is an example of COMPLETE PASR trading showing how we SEE PRICE ACTION and, CHANGE from basic PASR trading to PASR Trend Trading From the beginning of June 2017 through August 2017, PRICE was stuck in a TRADING RANGE between Support at BRN 1.75 and Resistance at BRN 1.93. We ALWAYS use basic PASR when PRICE is trapped in a TRADING RANGE. Towards the end of August and, from our UNDERSTANDING of PASR, we SEE that PRICE is very bullish and, through the UNDERSTANDING of the Strat Shadow, switch to PASR Trend Trading Again,...Ignored
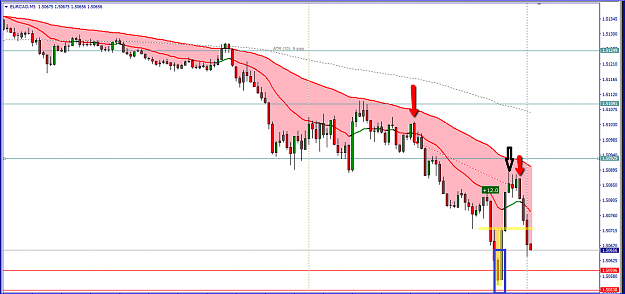
I was looking at your chart where it shows the PASR trend trading example and where you put your buy arrows. I understand the reason behind all those arrows except the 6th buy arrow (or the 2nd to last one). The bar is at the 20 ema, however, it isn't a hammer, BUEB, BUOB, or IB. I'm thinking the reason is because the bar opened below the 20 ema and closed above the 20 ema. Can you confirm this? or is there another reason?