I hope somebody in our community can make these indies. The strategy is below:
How a rating system works Morningstar offers a popular rating service that assigns star ratings based on analysts’ estimates of fair value. A five-star stock is a good value at its current price; a one-star stock isn’t. Star ratings, which are updated daily, can change for three reasons: when analysts alter their estimate of a stock’s fair value; when a stock’s price changes; or both. In the ratings, two different pieces of information—fair value and current price—are combined. Fair value is derived from an evaluation of the company’s business and has nothing to do with price.
It represents what analysts think the company’s value is. So if the current price is below fair value, the stock’s rating will be positive; the lower the price, the higher the rating. If the current price is above fair value, the stock’s rating will be negative. The logic is straightforward—if price is below value, you buy, if price is above value, you sell. The same logic is applied to any market analyzed. The two pieces of information are not updated at the same time. Fair value depends on analysts’ fundamental evaluation, which is updated quarterly or anytime there is a key change related to the company’s business. The current price, on the other hand, updates in real time. In order to transfer the same logic to a technical stock rating system, you would need some kind of technical parameters that indicate:
• If a stock is good or bad
• How good or bad it is. In other words, it should allow you to compare any stock against another to eventually rank the stocks.
Rate a stock’s trend Technical traders don’t consider fundamental information and have no fair value to compare against price. As a result, they cannot evaluate future price movement but can find, in past data, some predictive information with a high probability of success that can help indicate future price movement. I evaluated several technical indicators and came up with a combination of the following three technical indicators:
• One-year linear regression slope
• 12-week higher highs
• 12-week higher lows. These three indicators worked well together.
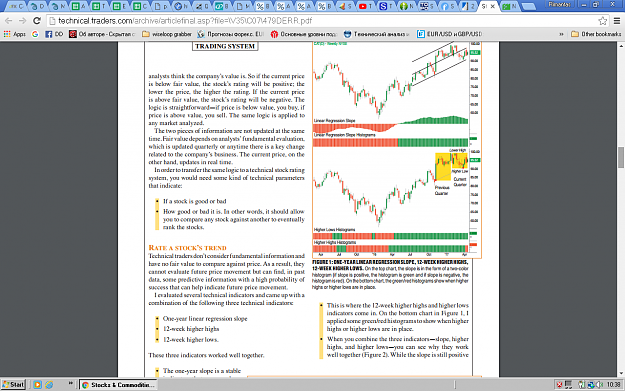
• The one-year slope is a stable indicator that can analyze trends: a positive slope detects an uptrend, a negative slope detects a negative trend. On the top chart in Figure 1, I transformed the slope into a two-color histogram (if slope is positive, the histogram is green and if slope is negative, the histogram is red). The reason for having a stable trend indicator is that you don’t want the indicator to change direction in case of pullbacks. The downside of this is that a slow trend indicator may have a lag in detecting tops and bottoms.
This is where the 12-week higher highs and higher lows indicators come in. On the bottom chart in Figure 1, I applied some green/red histograms to show when higher highs or higher lows are in place.
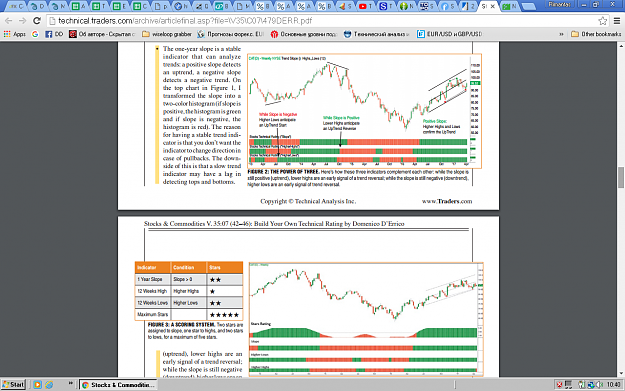
• When you combine the three indicators—slope, higher highs, and higher lows—you can see why they work well together (Figure 2). While the slope is still positive
• This is where the 12-week higher highs and higher lows indicators come in. On the bottom chart in Figure 1, I applied some green/red histograms to show when higher highs or higher lows are in place
. • When you combine the three indicators—slope, higher highs, and higher lows—you can see why they work well together (Figure 2). While the slope is still positive (uptrend), lower highs are an early signal of a trend reversal; while the slope is still negative (downtrend), higher lows are an early signal of trend reversal.
Assume these technical indicators hit the satisfactory mark. The next step is to transform the three indicators into a star ranking from 1 to 5.
Scoring I’ll start by assigning two stars to slope, one star to highs, and two stars to lows, for a maximum of five stars (Figure 3). I initially assigned a lower number of stars to higher highs because I believe that in the markets, lows are more important than highs. Later on, I will test this assumption to determine if it is correct. In Figure 4 you see the three indicators’ histograms and the star ratings from 1 to 5.
Trading rules: Buy if the stock rating is above 2.5 stars, sell if it’s below 2.5 Benchmark: Buy & hold SPY Trade size: $1,000 per trade Looking at the table in Figure 5 you can see that the stock rating strategy has about the same profit as the S&P buy & hold strategy, but the drawdown is lower ($19,897 for stock rating versus $76,315 for buy & hold), with a reward/risk ratio of 4.4 versus 1.2, respectively.
You can read full article in pdf file attached.
How a rating system works Morningstar offers a popular rating service that assigns star ratings based on analysts’ estimates of fair value. A five-star stock is a good value at its current price; a one-star stock isn’t. Star ratings, which are updated daily, can change for three reasons: when analysts alter their estimate of a stock’s fair value; when a stock’s price changes; or both. In the ratings, two different pieces of information—fair value and current price—are combined. Fair value is derived from an evaluation of the company’s business and has nothing to do with price.
It represents what analysts think the company’s value is. So if the current price is below fair value, the stock’s rating will be positive; the lower the price, the higher the rating. If the current price is above fair value, the stock’s rating will be negative. The logic is straightforward—if price is below value, you buy, if price is above value, you sell. The same logic is applied to any market analyzed. The two pieces of information are not updated at the same time. Fair value depends on analysts’ fundamental evaluation, which is updated quarterly or anytime there is a key change related to the company’s business. The current price, on the other hand, updates in real time. In order to transfer the same logic to a technical stock rating system, you would need some kind of technical parameters that indicate:
• If a stock is good or bad
• How good or bad it is. In other words, it should allow you to compare any stock against another to eventually rank the stocks.
Rate a stock’s trend Technical traders don’t consider fundamental information and have no fair value to compare against price. As a result, they cannot evaluate future price movement but can find, in past data, some predictive information with a high probability of success that can help indicate future price movement. I evaluated several technical indicators and came up with a combination of the following three technical indicators:
• One-year linear regression slope
• 12-week higher highs
• 12-week higher lows. These three indicators worked well together.
• The one-year slope is a stable indicator that can analyze trends: a positive slope detects an uptrend, a negative slope detects a negative trend. On the top chart in Figure 1, I transformed the slope into a two-color histogram (if slope is positive, the histogram is green and if slope is negative, the histogram is red). The reason for having a stable trend indicator is that you don’t want the indicator to change direction in case of pullbacks. The downside of this is that a slow trend indicator may have a lag in detecting tops and bottoms.
This is where the 12-week higher highs and higher lows indicators come in. On the bottom chart in Figure 1, I applied some green/red histograms to show when higher highs or higher lows are in place.
• When you combine the three indicators—slope, higher highs, and higher lows—you can see why they work well together (Figure 2). While the slope is still positive
• This is where the 12-week higher highs and higher lows indicators come in. On the bottom chart in Figure 1, I applied some green/red histograms to show when higher highs or higher lows are in place
. • When you combine the three indicators—slope, higher highs, and higher lows—you can see why they work well together (Figure 2). While the slope is still positive (uptrend), lower highs are an early signal of a trend reversal; while the slope is still negative (downtrend), higher lows are an early signal of trend reversal.
Assume these technical indicators hit the satisfactory mark. The next step is to transform the three indicators into a star ranking from 1 to 5.
Scoring I’ll start by assigning two stars to slope, one star to highs, and two stars to lows, for a maximum of five stars (Figure 3). I initially assigned a lower number of stars to higher highs because I believe that in the markets, lows are more important than highs. Later on, I will test this assumption to determine if it is correct. In Figure 4 you see the three indicators’ histograms and the star ratings from 1 to 5.
Trading rules: Buy if the stock rating is above 2.5 stars, sell if it’s below 2.5 Benchmark: Buy & hold SPY Trade size: $1,000 per trade Looking at the table in Figure 5 you can see that the stock rating strategy has about the same profit as the S&P buy & hold strategy, but the drawdown is lower ($19,897 for stock rating versus $76,315 for buy & hold), with a reward/risk ratio of 4.4 versus 1.2, respectively.
You can read full article in pdf file attached.
Attached Image(s) (click to enlarge)
Attached File(s)