Date: January 8, 2018
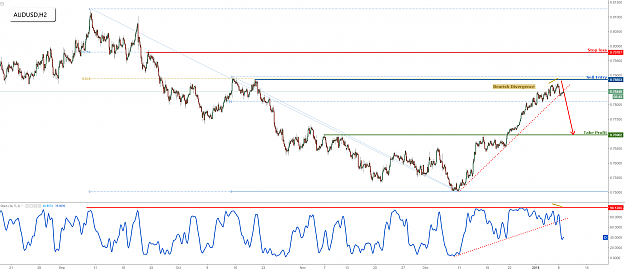
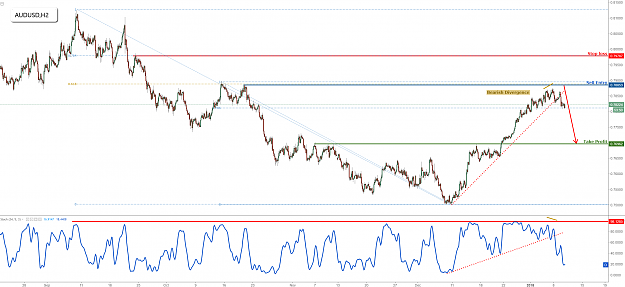
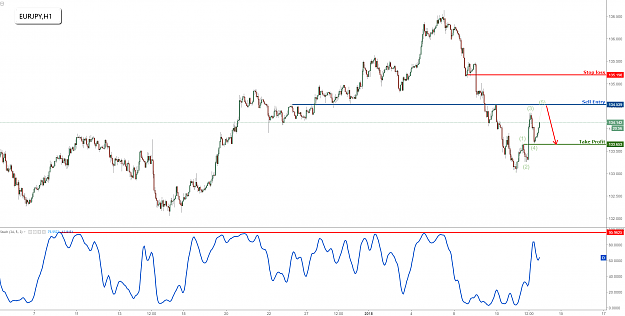
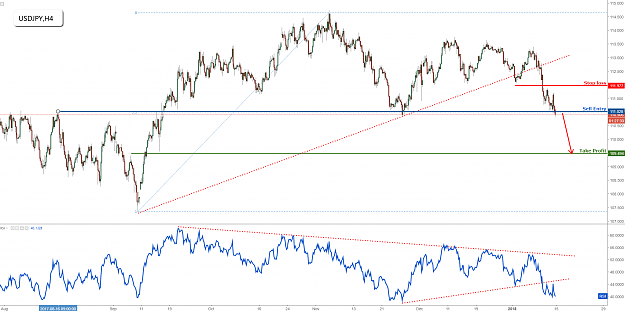
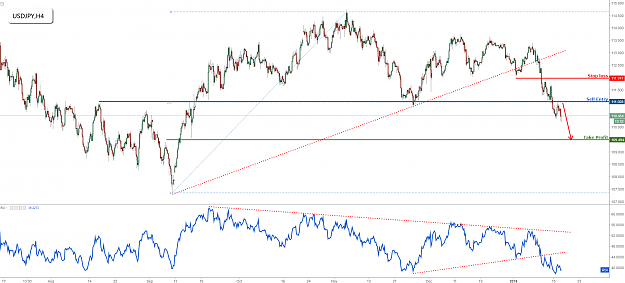
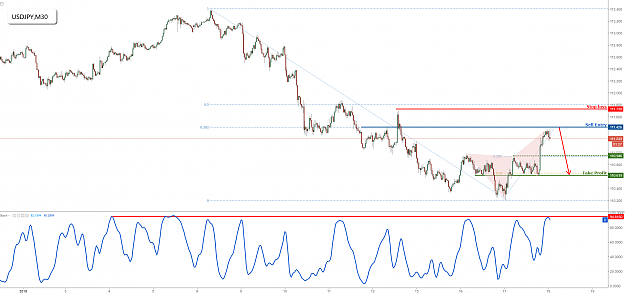
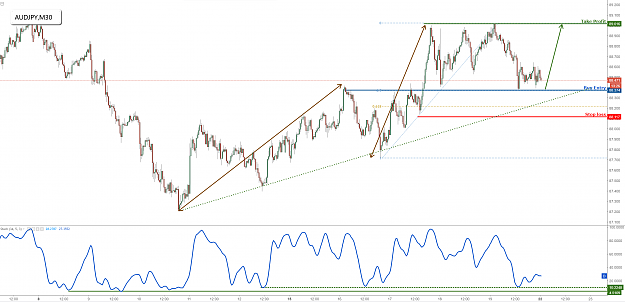
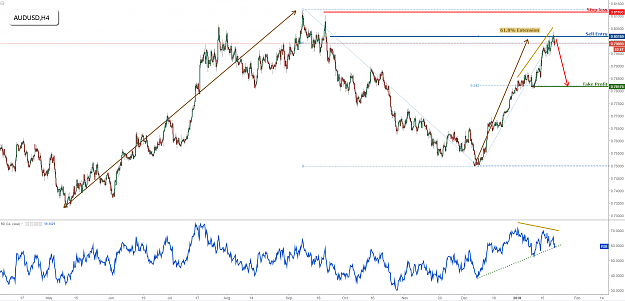
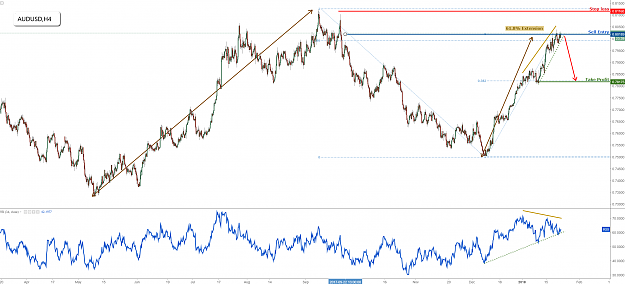
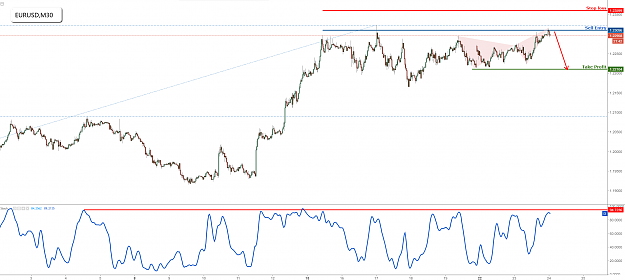
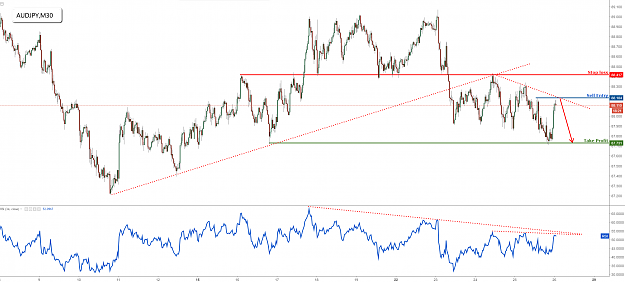
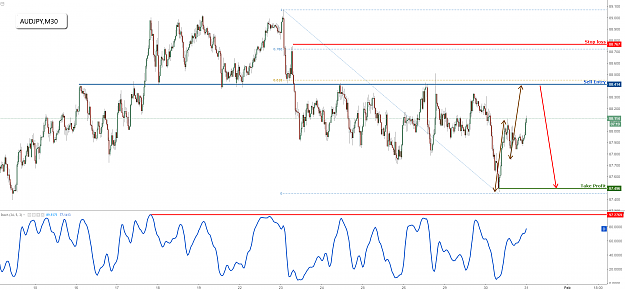
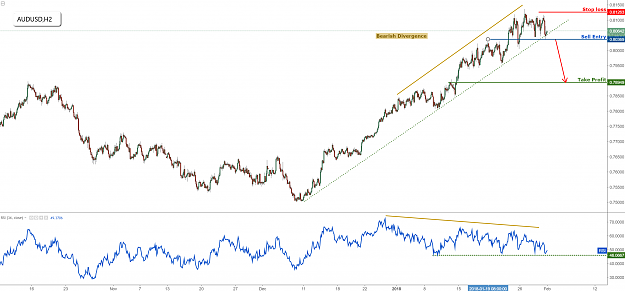
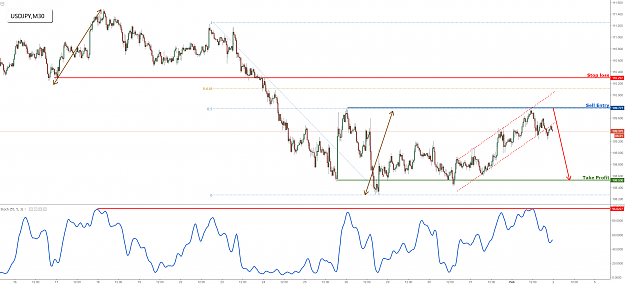
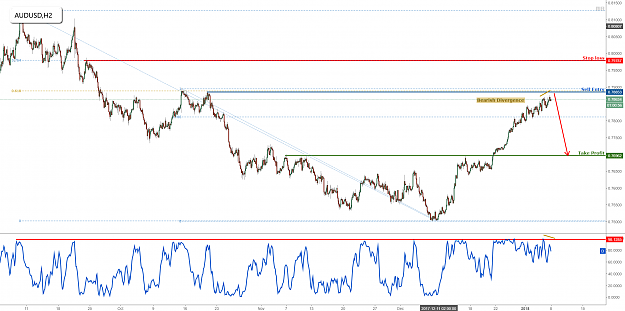
AUDUSD forming a nice reversal at key resistance, time to go short
Sell below 0.7885. Stop loss at 0.7978. Take profit at 0.7696
Reason for the trading strategy (technically):
Price is now testing major resistance at 0.7885 (61.8% Fibonacci retracement, horizontal swing high resistance, bearish divergence) and we expect to see a strong reaction off this level to push price down to at least 0.7696 support (Fibonacci retracement, horizontal pullback support).
Stochastic (34,3,1) is also testing major resistance at 98% and we can see bearish divergence vs price signalling that a reversal is impending.
Date: January 8, 2018
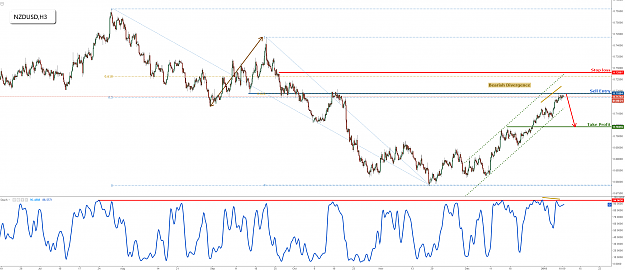
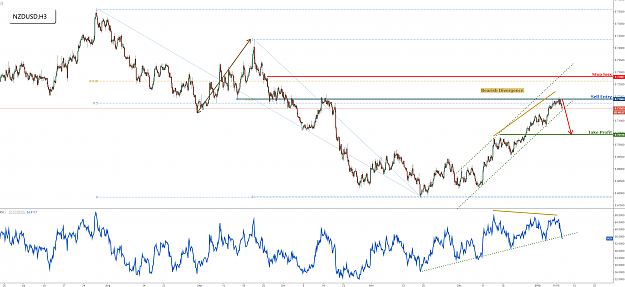
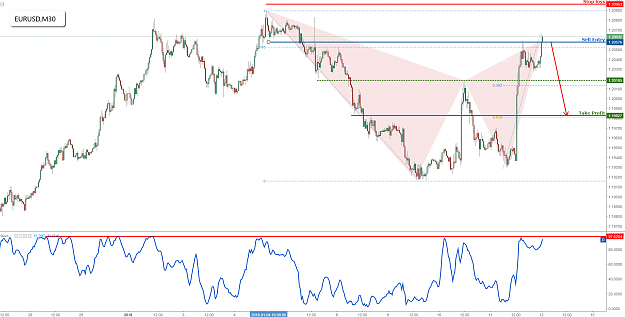
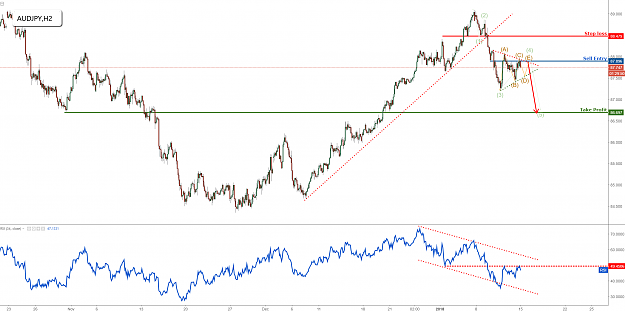
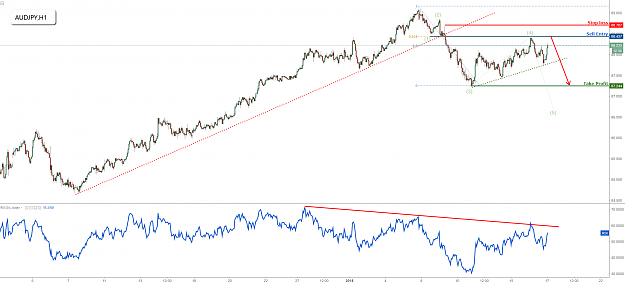
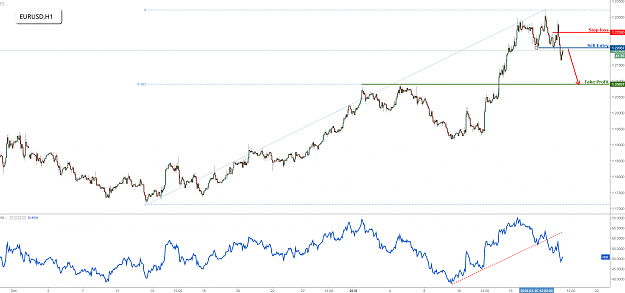
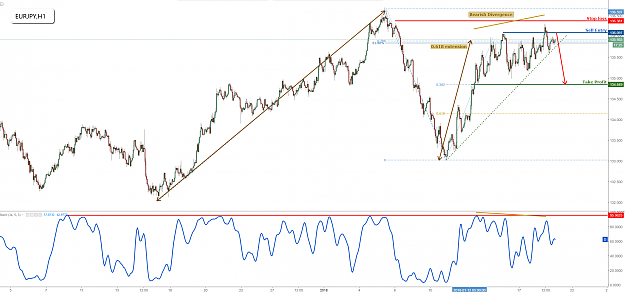
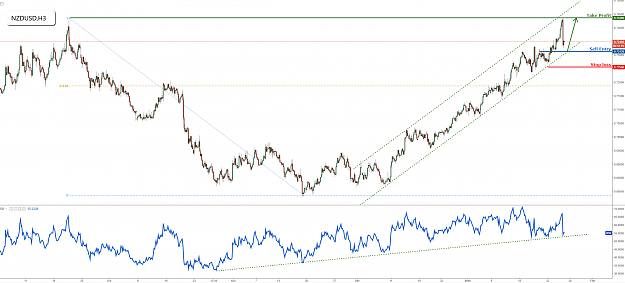
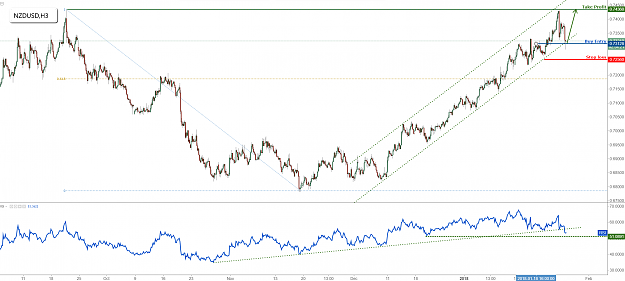
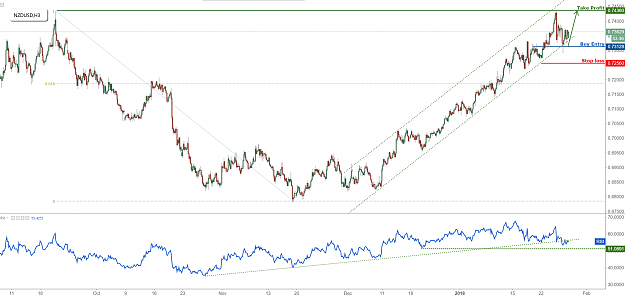
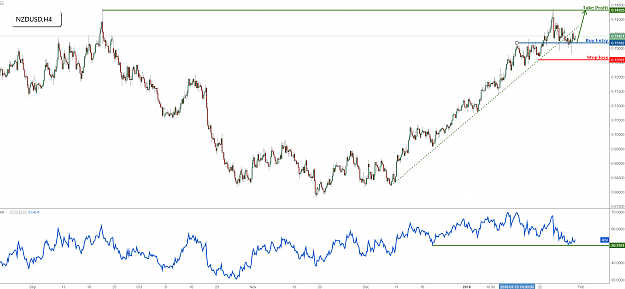
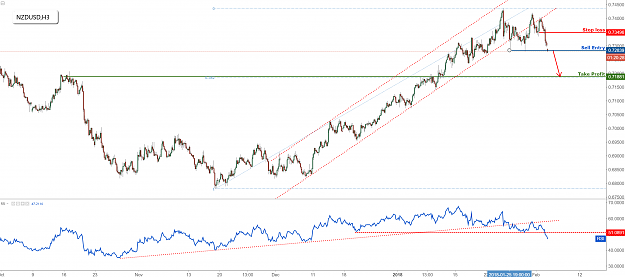
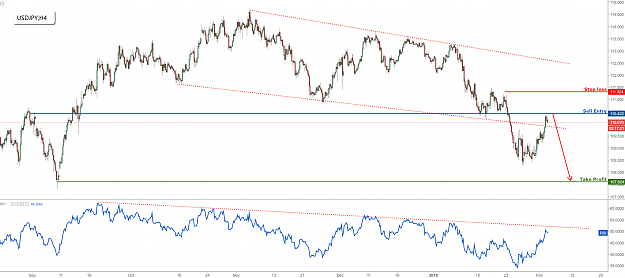
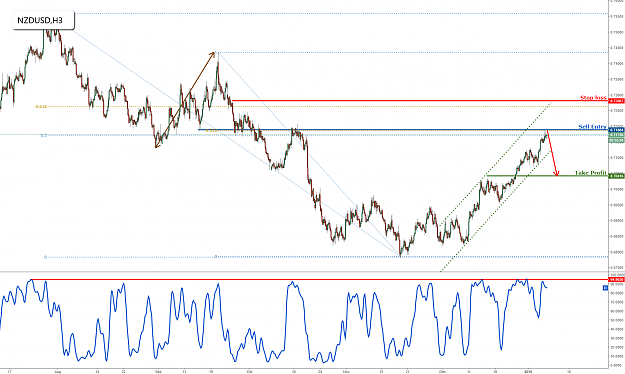
NZDUSD approaching major resistance, prepare to sell
Sell below 0.7188. Stop loss at 0.7280. Take profit at 0.7041.
Reason for the trading strategy (technically):
Price is testing major resistance at 0.7188 (Fibonacci retracement, horizontal overlap resistance, bearish divergence) and a strong reaction could occur at this level to push price down to at least 0.7041 support (Fibonacci retracement, horizontal pullback support). However, we are also in a bullish ascending channel and only a break of this channel would confirm further downside move.
Stochastic (34,5,3) is seeing major resistance at 94% and also displays bearish divergence vs price signalling that a reversal is impending.
Date: January 8, 2018
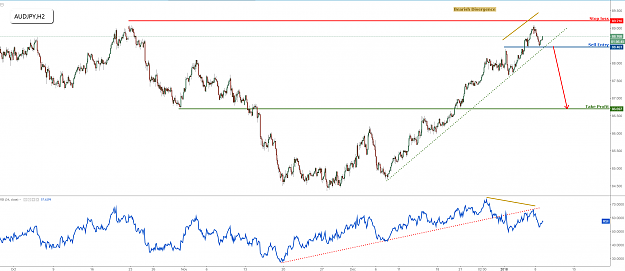
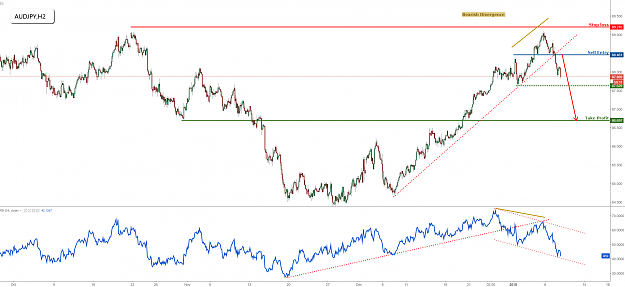
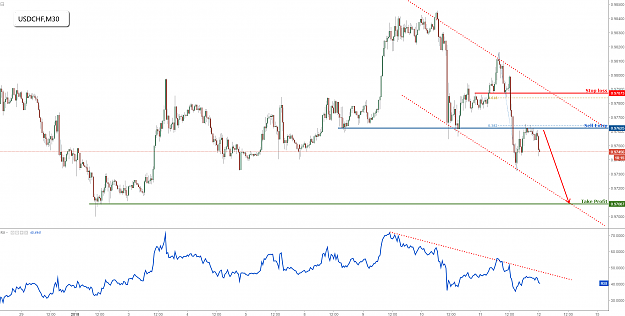
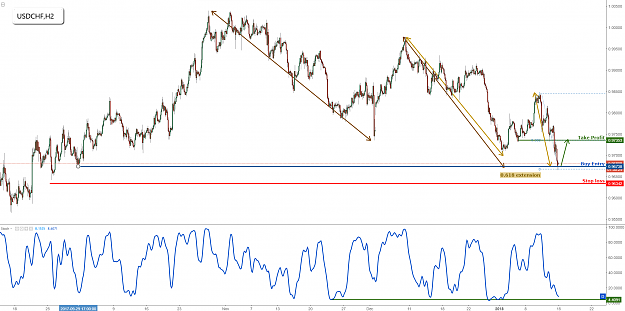
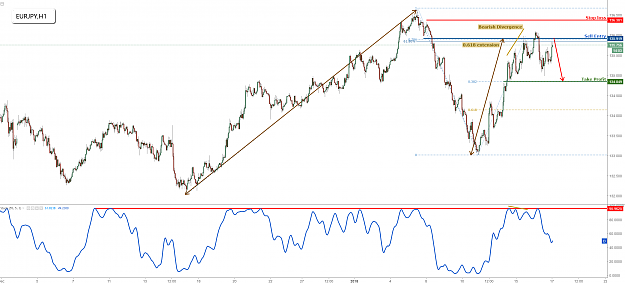
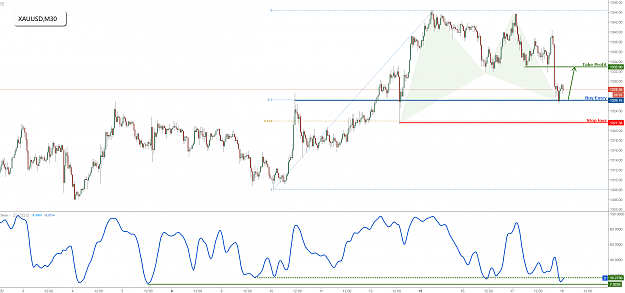
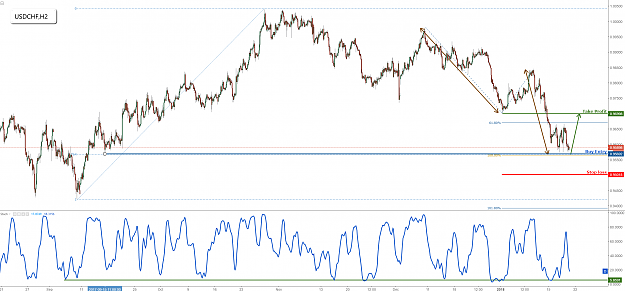
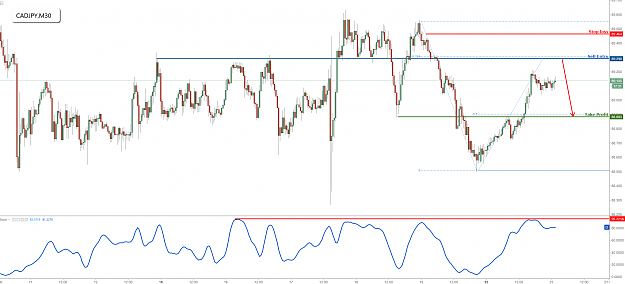
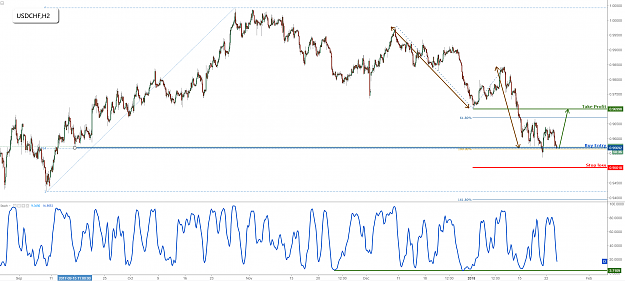
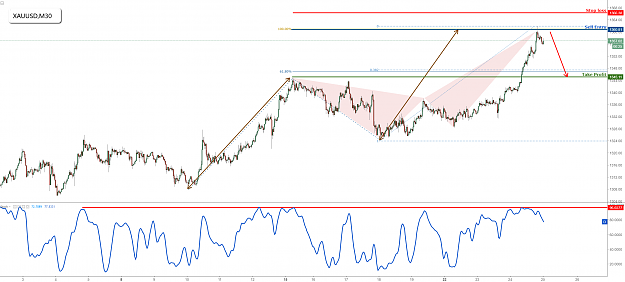
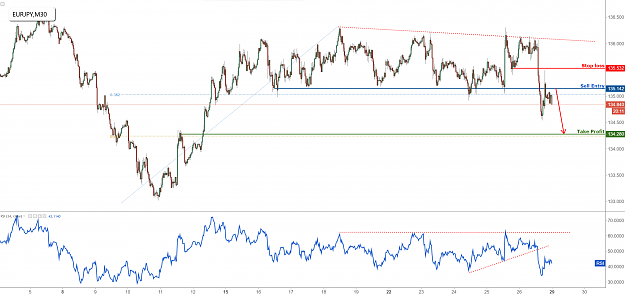
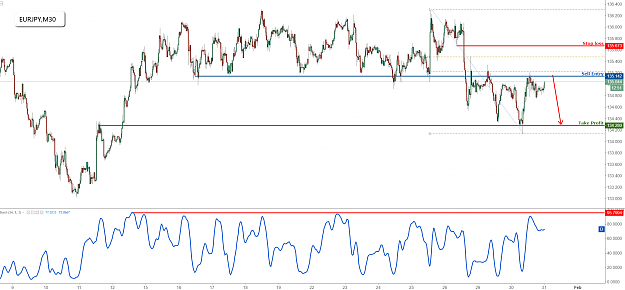
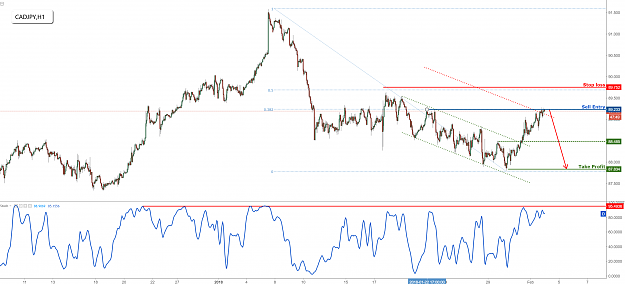
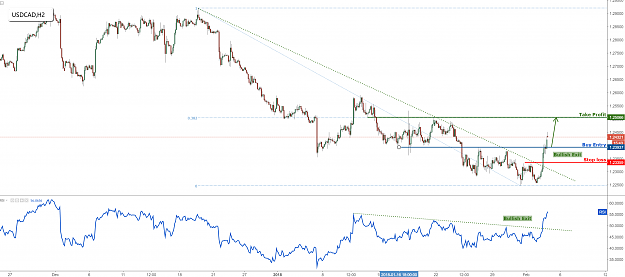
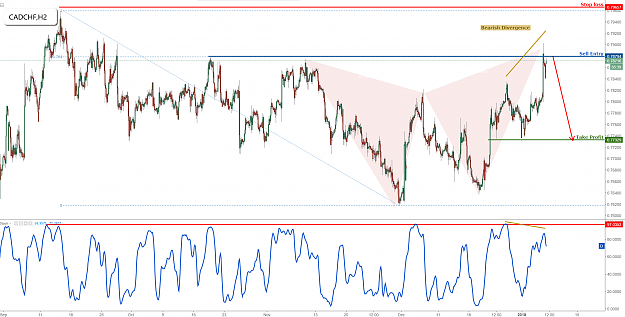
CADCHF forming a major reversal signal, time to sell
Sell below 0.7879. Stop loss at 0.7965. Take profit at 0.7732.
Reason for the trading strategy (technically):
Price has formed a bearish bat formation and also sees strong resistance at 0.7879 (Fibonacci retracement, horizontal swing high resistance, bearish divergence) and we expect to see a strong reaction off this level to push price down to at least 0.7732 support (Fibonacci retracement, horizontal swing low support).
Stochastic (34,5,3) is seeing major resistance at 97% and also bearish divergence vs price signalling that a reversal is impending.
Date: January 8, 2018
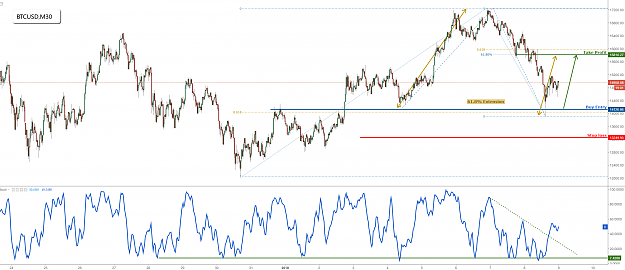
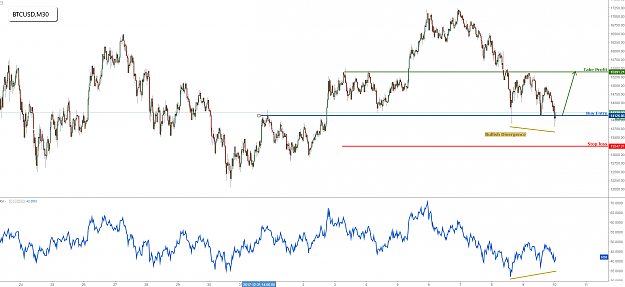
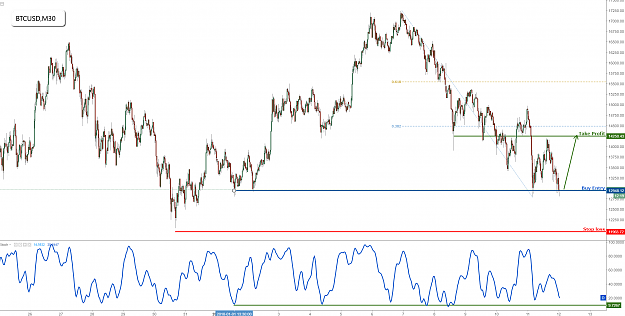
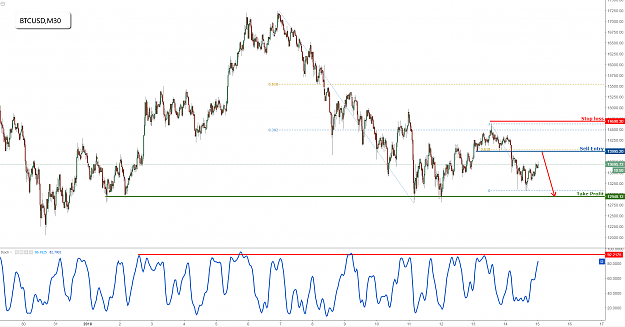
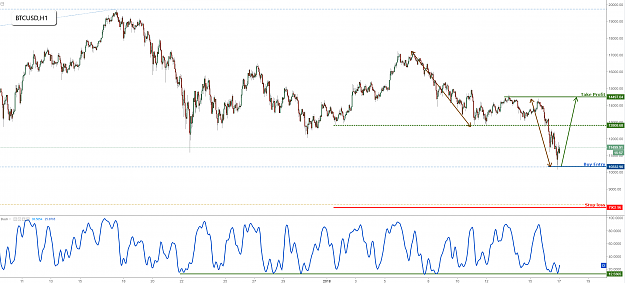
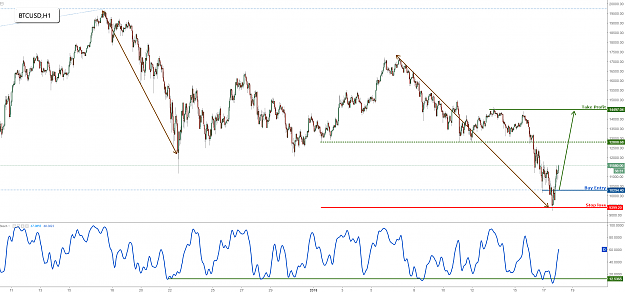
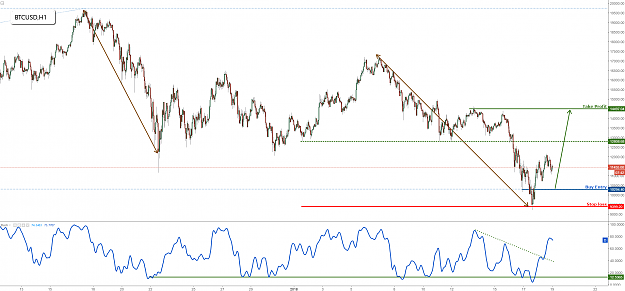
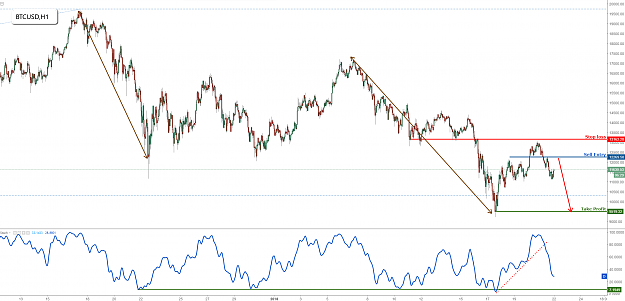
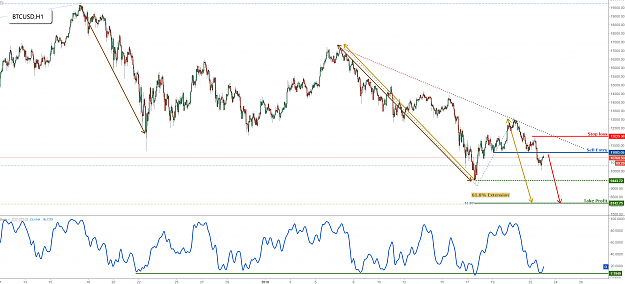
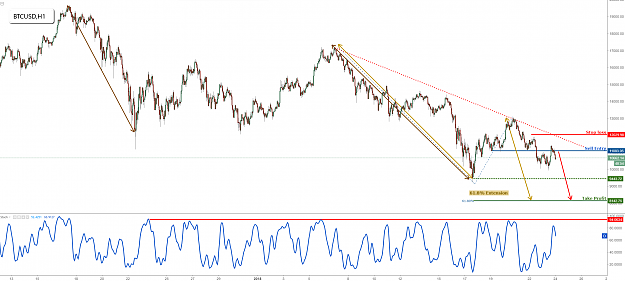
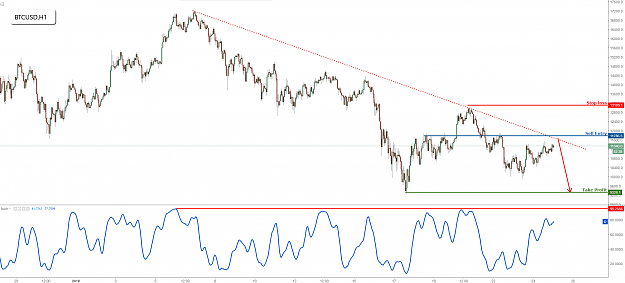
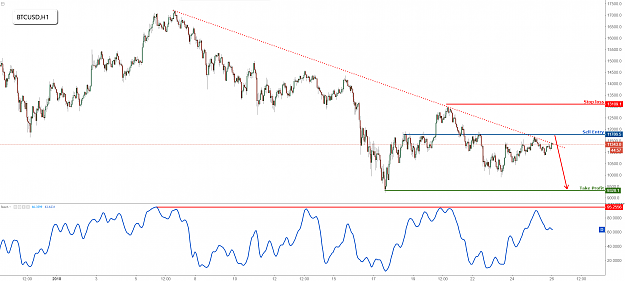
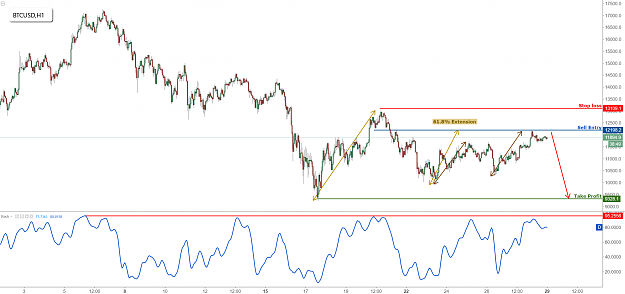
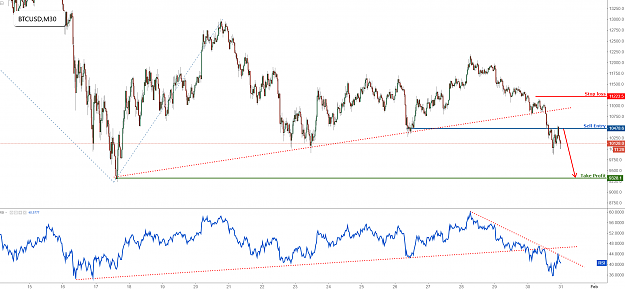
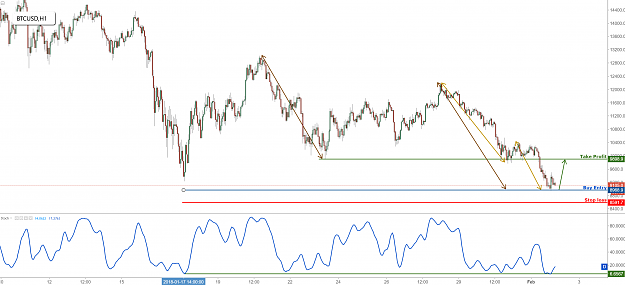
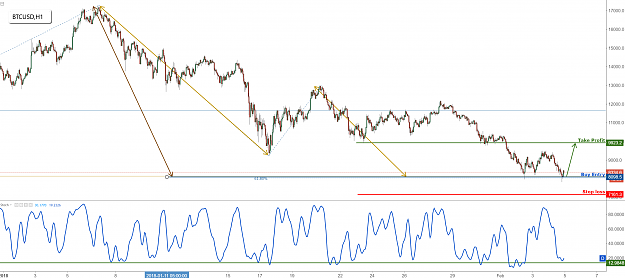
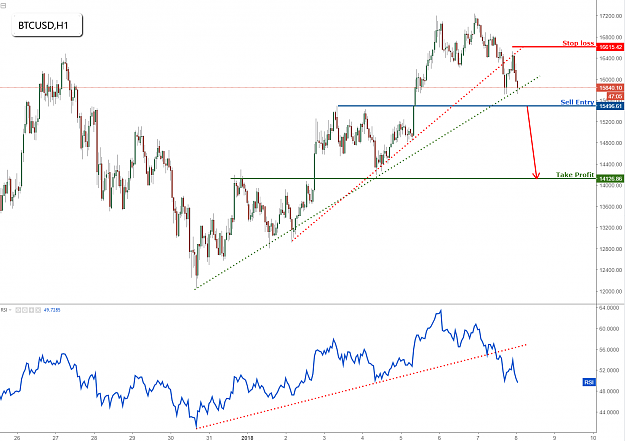
Bitcoin almost breaking out, prepare to short
Sell below 15496. Stop loss at 16615. Take profit at 14126.
Reason for the trading strategy (technically):
Price is seeing major support from our ascending support line and also at 15496 (Fibonacci retracement, horizontal pullback support). We will only sell on the break of this major support which would trigger a push down to 14126 support (Fibonacci retracement, horizontal overlap support).
RSI (55) has made a bearish exit of our long term ascending support-turned-resistance level and is a presignal that a strong drop could be occurring soon.
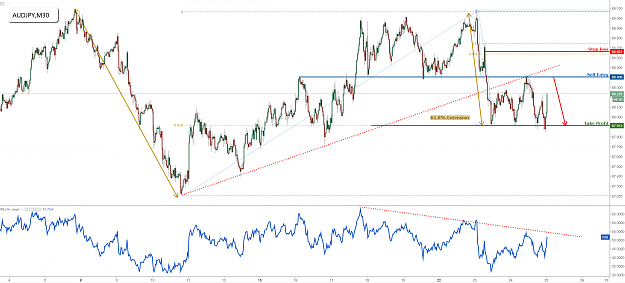
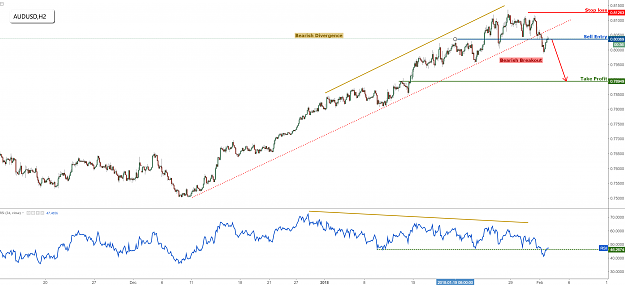
AUDUSD forming a nice reversal at key resistance, time to go short
Sell below 0.7885. Stop loss at 0.7978. Take profit at 0.7696
Reason for the trading strategy (technically):
Price is now testing major resistance at 0.7885 (61.8% Fibonacci retracement, horizontal swing high resistance, bearish divergence) and we expect to see a strong reaction off this level to push price down to at least 0.7696 support (Fibonacci retracement, horizontal pullback support).
Stochastic (34,3,1) is also testing major resistance at 98% and we can see bearish divergence vs price signalling that a reversal is impending.
Attached Image (click to enlarge)
Date: January 8, 2018
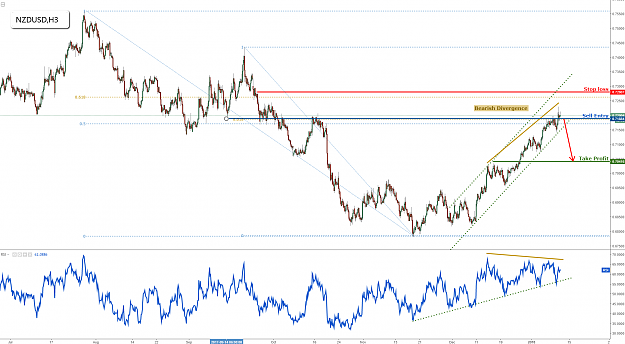
NZDUSD approaching major resistance, prepare to sell
Sell below 0.7188. Stop loss at 0.7280. Take profit at 0.7041.
Reason for the trading strategy (technically):
Price is testing major resistance at 0.7188 (Fibonacci retracement, horizontal overlap resistance, bearish divergence) and a strong reaction could occur at this level to push price down to at least 0.7041 support (Fibonacci retracement, horizontal pullback support). However, we are also in a bullish ascending channel and only a break of this channel would confirm further downside move.
Stochastic (34,5,3) is seeing major resistance at 94% and also displays bearish divergence vs price signalling that a reversal is impending.
Attached Image (click to enlarge)
Date: January 8, 2018
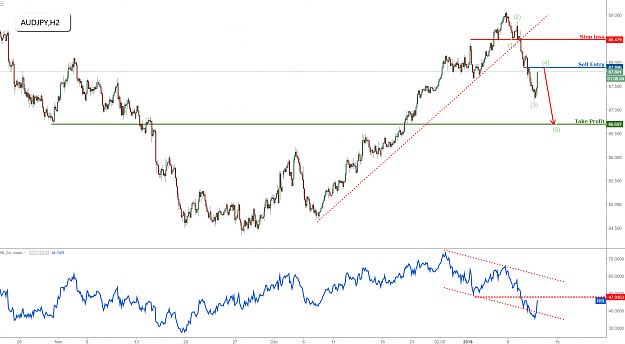
CADCHF forming a major reversal signal, time to sell
Sell below 0.7879. Stop loss at 0.7965. Take profit at 0.7732.
Reason for the trading strategy (technically):
Price has formed a bearish bat formation and also sees strong resistance at 0.7879 (Fibonacci retracement, horizontal swing high resistance, bearish divergence) and we expect to see a strong reaction off this level to push price down to at least 0.7732 support (Fibonacci retracement, horizontal swing low support).
Stochastic (34,5,3) is seeing major resistance at 97% and also bearish divergence vs price signalling that a reversal is impending.
Attached Image (click to enlarge)
Date: January 8, 2018
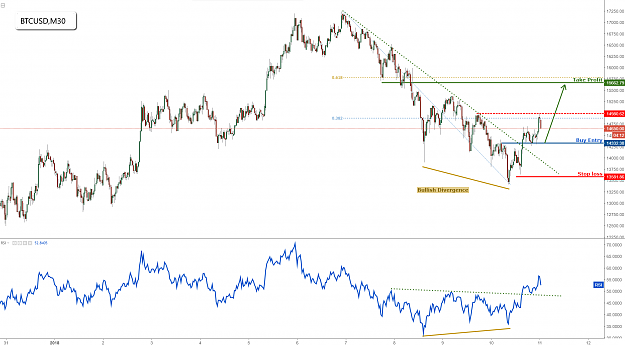
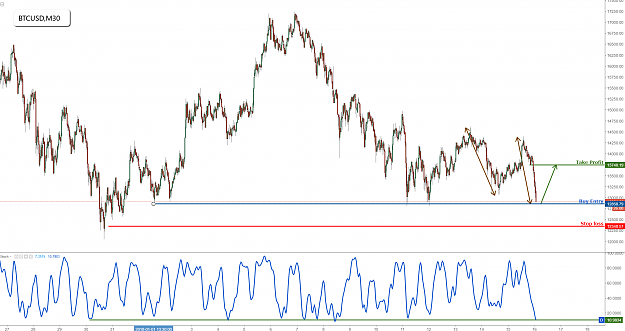
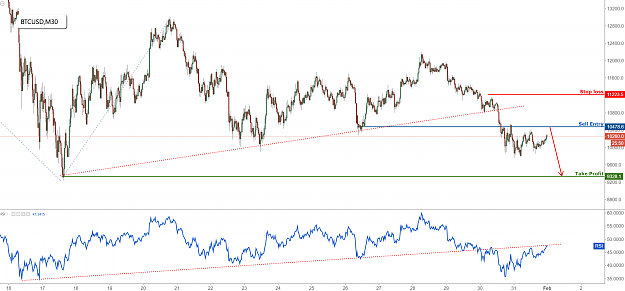
Bitcoin almost breaking out, prepare to short
Sell below 15496. Stop loss at 16615. Take profit at 14126.
Reason for the trading strategy (technically):
Price is seeing major support from our ascending support line and also at 15496 (Fibonacci retracement, horizontal pullback support). We will only sell on the break of this major support which would trigger a push down to 14126 support (Fibonacci retracement, horizontal overlap support).
RSI (55) has made a bearish exit of our long term ascending support-turned-resistance level and is a presignal that a strong drop could be occurring soon.
Attached Image (click to enlarge)
1