i have a question to fxtimer,crodzilla,codebreaker and other experts...instead of simply adding up all the waves, is there a better way to find which cycles you want to use in the current bar?thanks,deivi
If this is something you are interested in, you can find it on another forum; I'll send it to you if you need it; I can't post it because it is not in the public domain.
Ignored
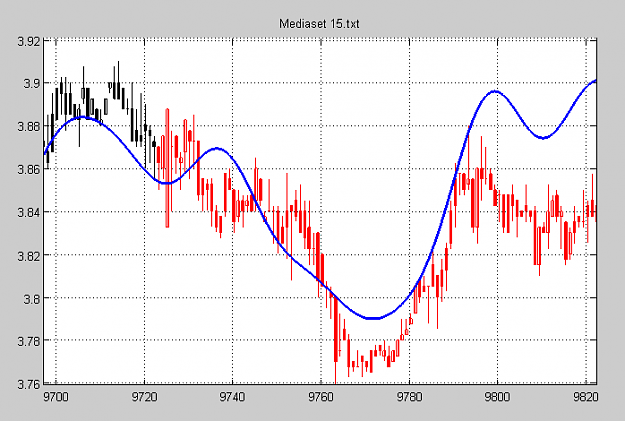
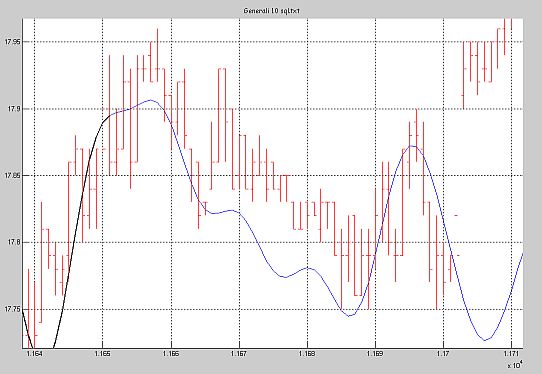
MisterH. I would love to know more about the filter that produced the picture you posted in this forum. Is this something that you might send me privately if you can't post here? I'm sorry for the general public posting, but I don't have a way to message you privately.
function y=asm8086filter2(open,high,low,close)
%y=asm8086filter2(open,high,low,close)
%
%asm8086 Filter from post #699
%http://www.forexfactory.com/showpost.php?p=3371056&postcount=699
    N=length(open);
    if(length(high)==N && length(low)==N && length(close)==N)
        if(N > 116)
            [hopen,hhigh,hlow,hclose]=HeikinAshi(open,high,low,close); %#ok<NASGU>
            x=(hhigh+hlow).*0.5;
            H0=ullma(0);
            H1=ullma(1);
            h0x=H0.filter(x);
            h1h0xd=H1.filter([0;diff(h0x)]);
            H0.States=0;
            h0h1h0xd=H0.filter(h1h0xd);
            y=h0x+(h1h0xd.*2-h0h1h0xd);
            y(1:116)=0;
        else
            error('input vectors length must be greater than 116');
        end
    else
        error('input vectors must have the same length');
    end
end
function [hopen,hhigh,hlow,hclose]=HeikinAshi(open,high,low,close)
%[hopen,hhigh,hlow,hclose]=HeikinAshi(open,high,low,close)
%
%Heikin-Ashi Indicator
    N=length(open);
    hopen=zeros(N,1);
    hhigh=zeros(N,1);
    hlow=zeros(N,1);
    hclose=zeros(N,1);
    hopen(1)=open(1);
    hhigh(1)=high(1);
    hlow(1)=low(1);
    hclose(1)=close(1);
    for n=2:N
        hclose(n)=(open(n)+close(n)+high(n)+low(n))*0.25;
        hopen(n)=(hopen(n-1)+hclose(n-1))*0.5;
        hhigh(n)=max([high(n);hopen(n);hclose(n)]);
        hlow(n)=min([low(n);hopen(n);hclose(n)]);
    end
end
function H=ullma(type)
%H=ullma(type)
%
%Codebreaker's "Ultra Low Lag Moving Average" Clone
%http://www.forexfactory.com/showthread.php?t=68181&page=10
    Length=39;
    switch(type)
        case 0
            Cycles=1.25;
        case 1
            Cycles=2.5;
        case 2
            Cycles=3.75;
        case 3
            Cycles=6.25;
        otherwise
            error('Unknown type');
    end
    x=(0:1/(Length-1):1)'.*(Cycles*pi);
    h=sinc(x);
    h=h./sum(h);
    H=dfilt.dffir(h);
end
vit46 & LuboLabo,
I don't think to make a mql4 version of EMD/DESA or of my second filter because I don't use MT4 and so I don't need it, but you can program it yourself (EMD is a big piece of code).
Im not sure about this Heikin-Ashi candlestick plot.
Your candle stick is already a filtered version of a normal candlestick, so your graph isn't showing the true price.
Hence your trades are unlikely to be as clean as that
Ignored
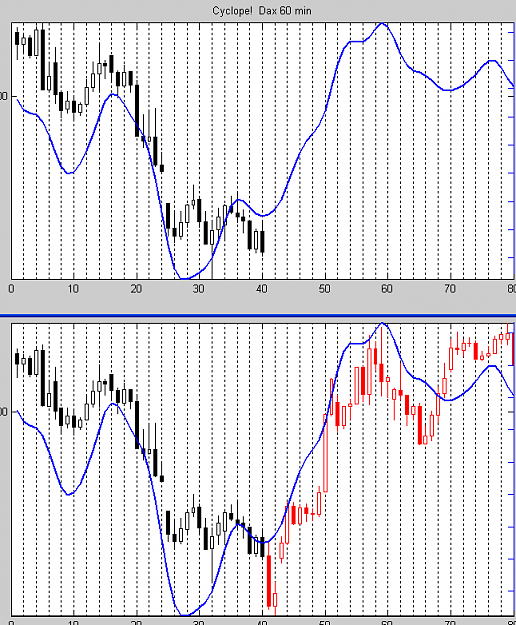
quibowibbler,
This is completly wrong, the candlesticks at input are not already smoothed before entering the filter, so the graph you see in the post #699 is correct, I mean the candles ploted there are the real prices but only Highs and Lows to reproduce the style of the original chart by CB, there's no cheating.
Take a look a bit more at the code...
as I stated previously, all job was done using Herbst and Bartels approach as described in "Analyzing and forecasting future prices", but with some modifications to the original concepts.
I don't even know what this link is about.
I have nothing to sell, only I'd like to improve what's done so far.
very interesting post and a lot of great math and dsp skill people here!
Someone before wrote about Bartels, Fourier and so on; following Herbst's book I have developed the whole process in Matlab, with some modifies.
Results are very good but I wish to improve and I wonder if there is someone interested in collaboration. Dsp and Matlab knowledge is required.
Than you very much....
Ignored
Last year you were trying to find some people to work with the same and showing the same picture. So what was your results during this year ?
Are you able to post in sample and out of sample real trading results ??
What is your method to distinguish that this picture is a result of real predictive power not just luck ??
Herbs't book is quite old. Why you assume that what he writes is correct ?
as I stated previously, all job was done using Herbst and Bartels approach as described in "Analyzing and forecasting future prices", but with some modifications to the original concepts.
I don't even know what this link is about.
I have nothing to sell, only I'd like to improve what's done so far.
You are right, this is the same snap I've posted last year, but I can attach others if you prefer.
First question: the results are in an improved stability of the system, found some bugs and added some additional features.
Second question: no I am not able to show any in sample and out of sample result since this is not build as a trading system.
Maybe it is possible to turn as a TS but this is not my goal
Third question: most of the predict are really good as for trend detection as for pivot points (tops and bottoms), and since it is not a up or down but rather a combinations of more directions and turning poitsn detection, I hardly believe it is due by chance.
I am not telling this is for sure, maybe you are right here also and every good predict are by luck.
Fourth question : yes the book is 20+ years old, I am not assuming his approach is 100% correct, I am saying I like this approach and I would like to go on with this way and try to modify and improve.
I like very much what's done so far, I think more can be done and I would like to continue in this direction, but I have no certainties, maybe it is all rubbish.
I only found someone talking about Bartels in this post and want to join the efforts, I need collaborations from dsp experts since I am not.
Last year you were trying to find some people to work with the same and showing the same picture. So what was your results during this year ?
Are you able to post in sample and out of sample real trading results ??
What is your method to distinguish that this picture is a result of real predictive power not just luck ??
Herbs't book is quite old. Why you assume that what he writes is correct ?
I know this approach and I know Theodore himself, he helped me in using ssa for financial time series analysis, as you can see from his curriculum vitae
Second question: no I am not able to show any in sample and out of sample result since this is not build as a trading system.
Maybe it is possible to turn as a TS but this is not my goal
So what is your goal than ?
So does it mean that you never made any statistic of accuracy of this preditction in and out of sample ?? But you said like a year ago that you were cooperating with mathematician specialized in statistic than why it was not done ?? Its easy in Matlab ??
Here is something pretty close to CB's clutter filter. I program only slowly in MT4, but do okay in afl, so I did it on AmiBroker. This is the idea:
Use the ULLMA of HA as suggested by ASM8086
Let Noise = HaHigh(ULLMA(OHLC)) - HALow(ULLMA(OHLC))
Let Signal = K*slope(ULLMA((HaHigh(ULLMA(OHLC)+HaLow(ULLMA(OHLC))/2)
Let SNR = 20 log(Signal/Noise)
Plot yellow bars if SNR<Threshold. (This is clutter)
I do not have the ULLMA in AFL, and did not want to write it there, so I used Igorads NLMA with length 15 as a proxy....
Ignored
hi madcow,
i work in amibroker & mt4 language is new to me.i wanted to convert igorads nonlag ma into afl but cant.
pls can u give the afl for igorads nonlag ma & also the ULLMA in afl.
thnks for ur help.
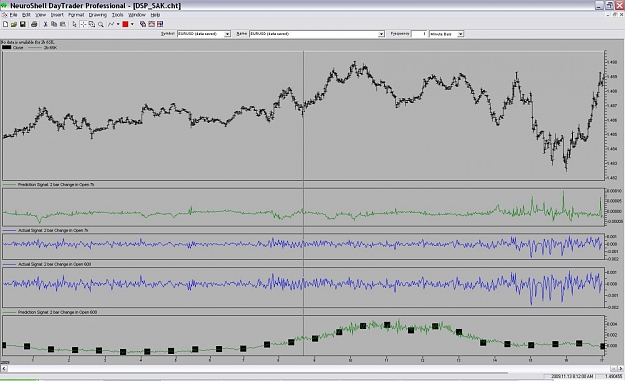
I made some in my opinion interesting test. I wanted to verify if DSP filters are giving valuable input for the strategies when input data
series are financial DS.
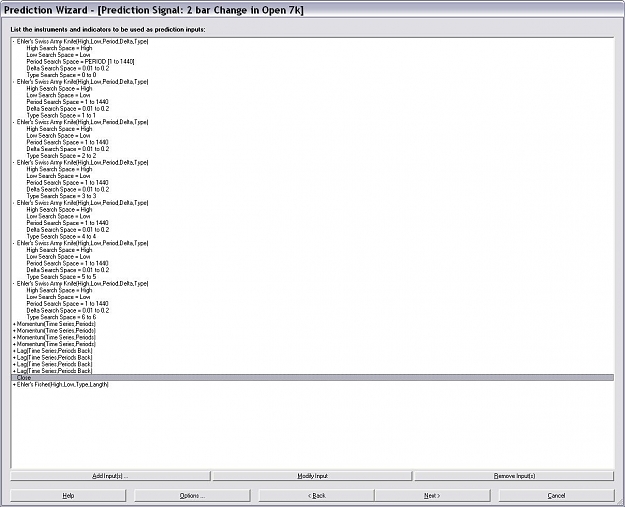
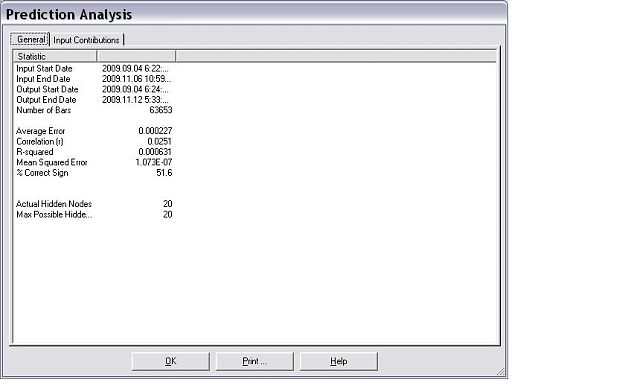
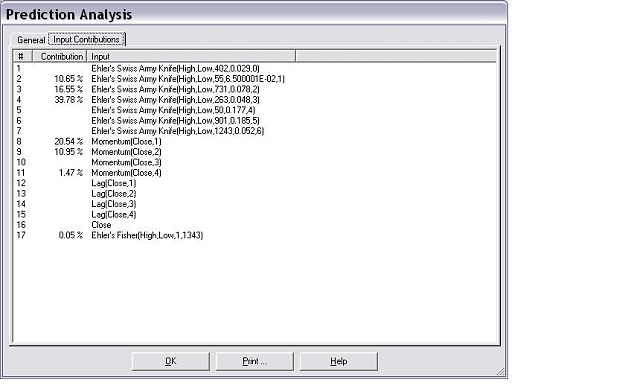
For this i used NS and put outputs from filters as a input to NN prediction together with other inputs see screens. DSP filters used where from J. Ehler paper 'Swiss army knife'
I made this test for three EURUSD files with 65k, 7k, and 600 1 min bars. The fitness function was 'maximize correct sign',
prediction suppouse to predict close change of two bars in the future. Analyzing the contributors after NN optimization
is possible to say what was valuable input to get the best fit.
For comparision i made the same test on 600 bars sin + cos signal