I'm trying to keep my losses minimal. So why did I get out ? well obviously just after the first bullish candle closed I got a snap back, pretty strong even on 1h. And here's how I'll be tackling this kind of setup. I won't trade them. That's it. I won't trade them, I was going against the main trend on 1h which was down for a week, I was impatient that's how I went long there before even waiting for another hour for another bullish candle.
It was a bad decision and I had to get out early. I think I"m slowly learning to differentiate between bad setups, bad entries to just give it a time there's going to be bounce back before it heads the intended direction. That's a plus. At least.
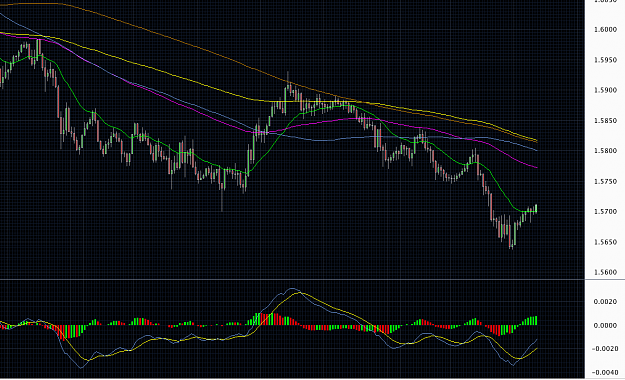
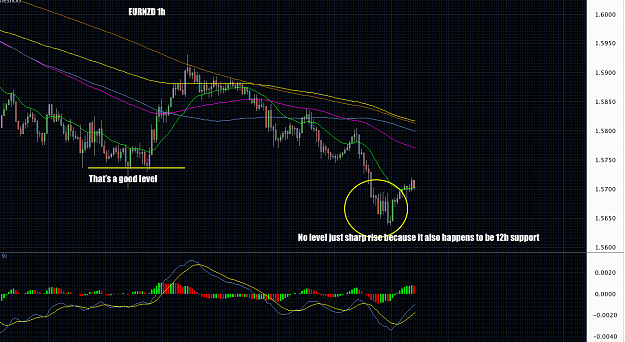
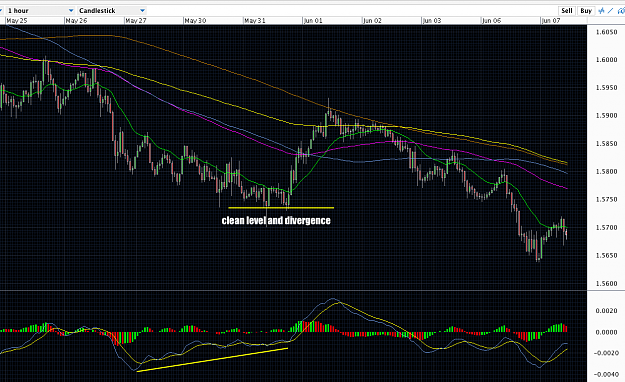
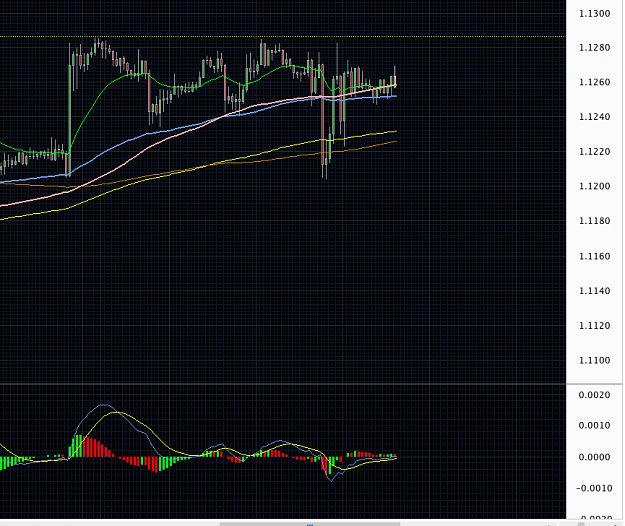
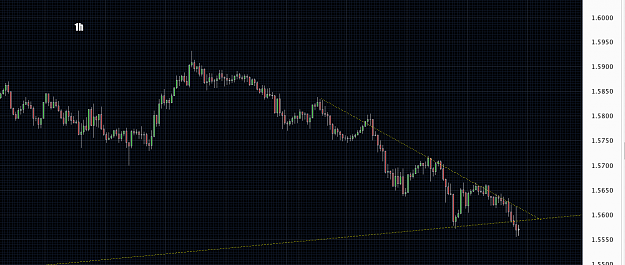
Check out EURNZD 1h chart, see the level I drew a yellow line ? if I'm going to be go against the trend I might as well go long on these kind of areas instead of sharp rises like whats happening to EURNZD now. It could always and easily snap back at me, it formed a sharp rise just because 12h 200SMA was beneath it not because it is going up, at least for now that seems to be the case.
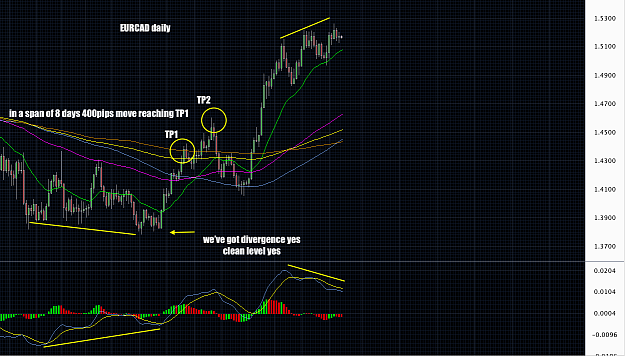
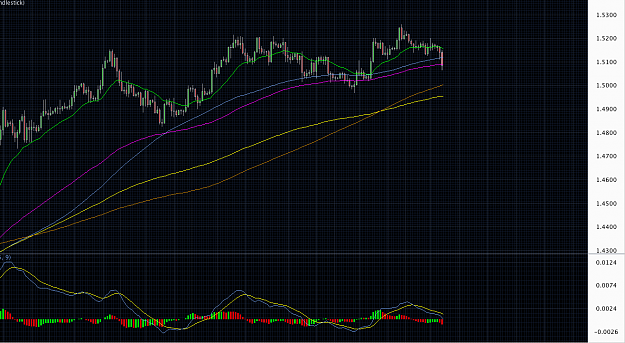
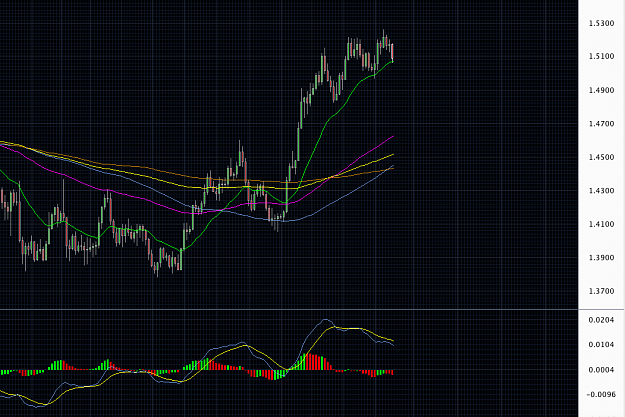
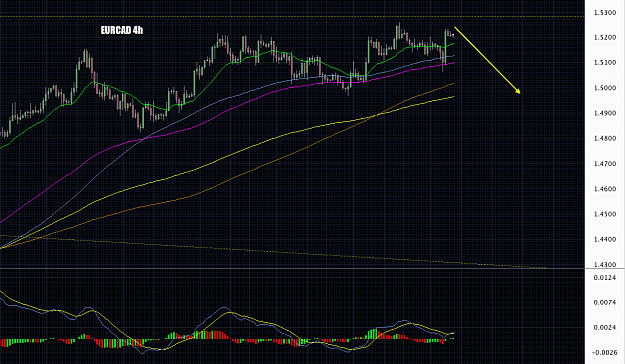
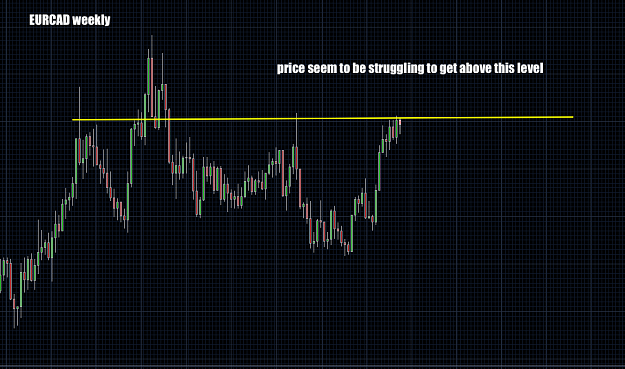
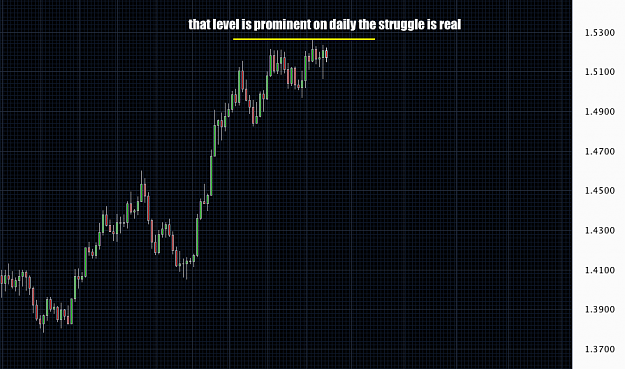
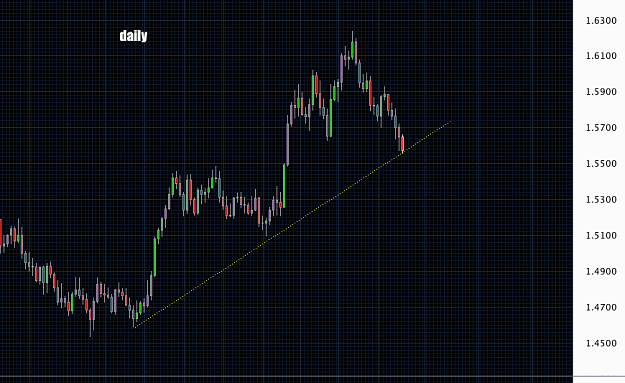
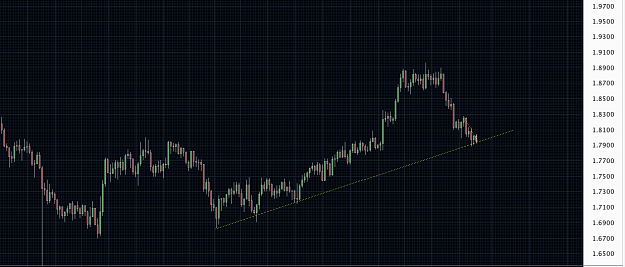
it looks like we might be reaching a top on EURCAD on daily.
you know what I really want to give daily a chance ?
chart is a chart, but if you are planning on trading minute or even 15m and 30min you must have combination of other TFs preferably higher than the one you will make
your entries you must be well versed in multi frame trading.
And let me tell you it is very difficult. It will take years to master the multi frame trading but like I've been saying it can be done and it can be very lucrative but at the
same time it can cause great havoc and stress if you're not built for this type of trading and if you lack the stamina that's required for training to be a master.
The longer I trade the more I realise I might not be the best fit for this type of trading. See how I didn't make a dime for a year and a half, thats an achievement to take
serious look at my self as a trader and evaluate what works and what doesn't. Whats worth investing more time and whats best to just abandon altogether.
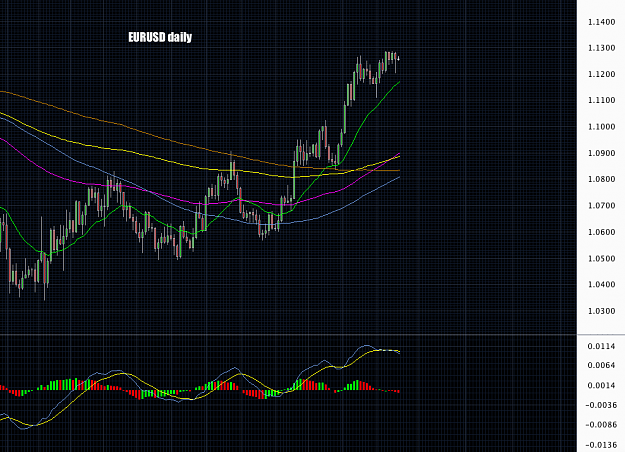
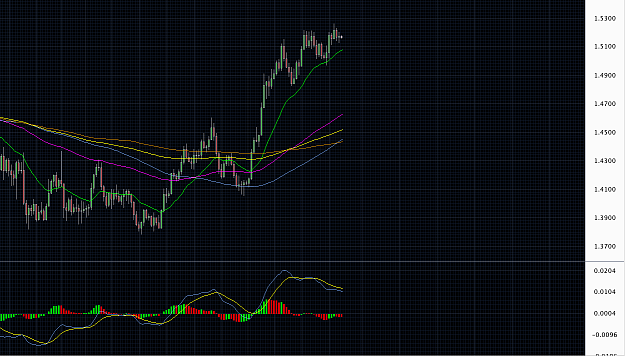
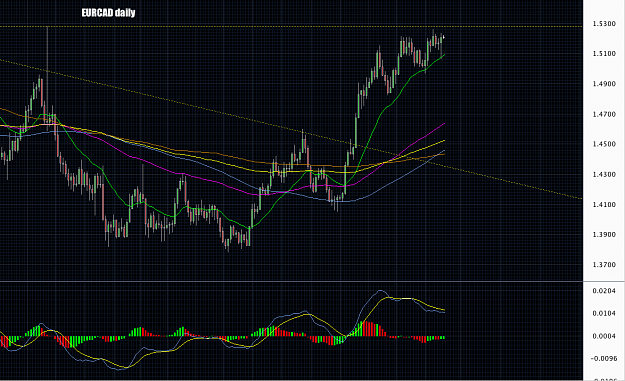
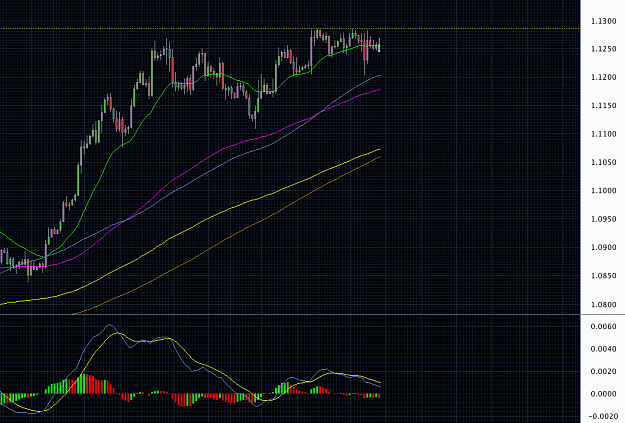
Trading daily on the other hand you don't need to look at multiple TFs as long as your entry is well timed on daily you should be fine most of the time. Look at
EURCAD daily. Patterns don't look much different to 1h, or 4h but its going to be less stressful and if you're patient enough you can pocket hundreds of pips from single
trade. Say I went long at around 1.3930 as soon as diversion completed and bullish candle closing right below daily 20ema with SL set 10points away from the lowest
point. If you have the guts and patience to stick with your trades in a span of 8 days you'd be sitting with 400pips. RR of daily setups will be at least 1:2 most trades
If I'm on daily I don't give a fuck about whats on the calendars. Sure I'll keep it up to date but when does it really matter ? Pattern is a pattern, set up is a setup. I'll
close the trade if I see a candle or for a technical reason. Because moves can fade and expectation can start a move to the opposite direction regardless of the outcome
of the announcement but there will be exceptions of course. But generally you shouldn't put too much emphasis on whats up with the calendar, or fundamentals shall I ?
don't bash me I've traded fundamentals and even COT when I was new and fresh, do they really matter if you asked me, no they don't unless of course you're an
investor but not for the day trader who scalps minute charts or swing traders. Sure some days such events will create unwanted volatility that if your SL is too tight
your position could get wiped, and soon the initial move fades and voila its back to where it started. Just talking about dealing with it gives me major migraine attack.
I want to hold it with SL set on daily BUT election is due tomorrow and I don't want to be caught on the wrong side. I'll trade daily once we're done with the election.
So EURNZD long that I had and closed it at -1$ was a bad decision obviously.
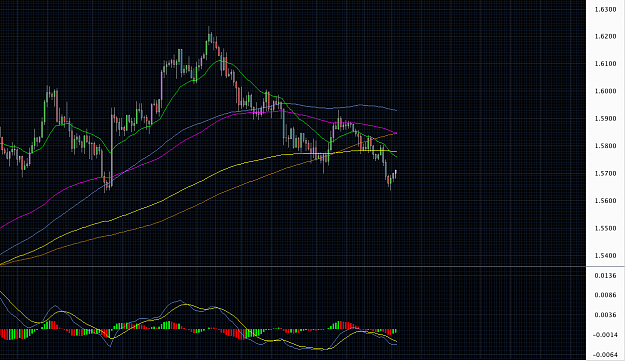
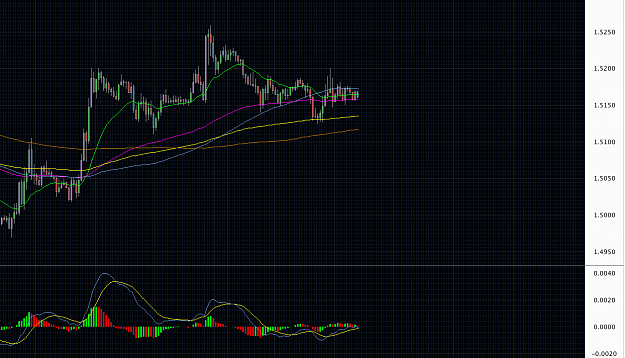
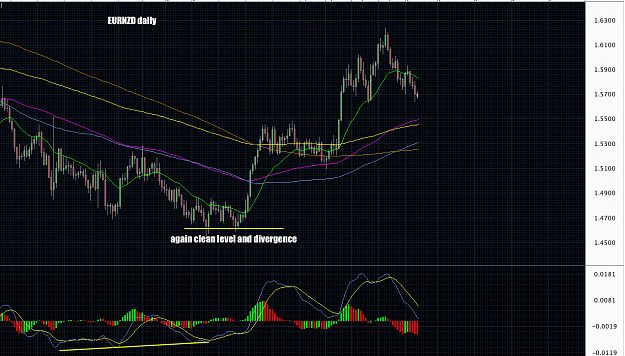
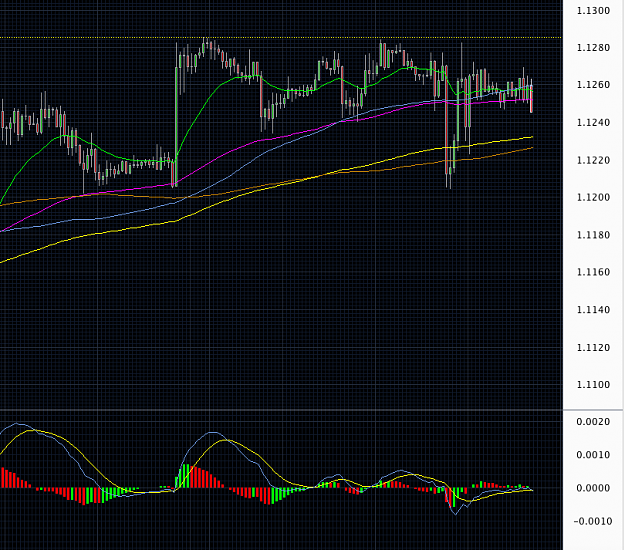
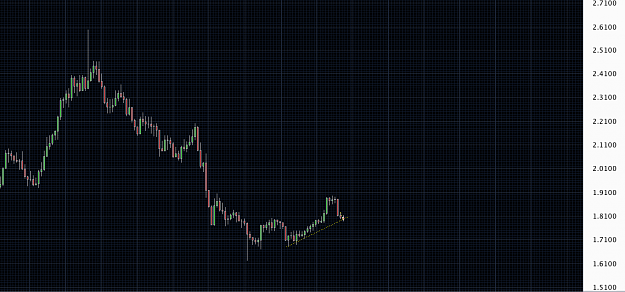
Here's EURNZD 1h and EURNZD daily chart. Pattern repeats itself across all TFs, it seems. So if you aren't doing well on 1h what makes you think you'll do well on
daily? Aside from the joke I want to trade daily.
EURNZD short was purely my fault. I won't take these up again. I'll only go up on instances such as this (attached chart) much like when I'm calling the top I
usually wait for multiple touchdowns on a single level with diversion before pulling the trigger.
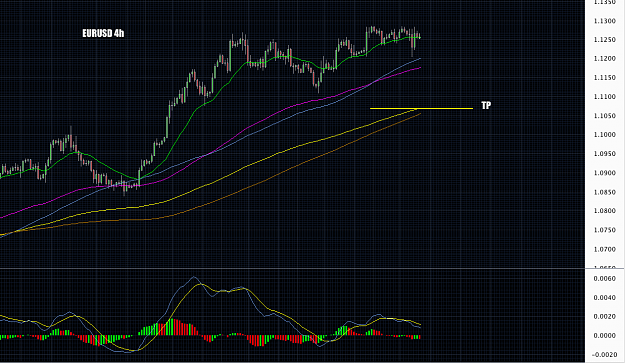
I admit that I may gotten into EURUSD a bit early however on 4h I did see a bearish candle closing below 20ema we'll see how it pans out. At around 6:00GMT we might see some movement for now its pretty much on standstill mode everything except for some AUD weakness EURAUD and GBPAUD is in a correction mode for now.
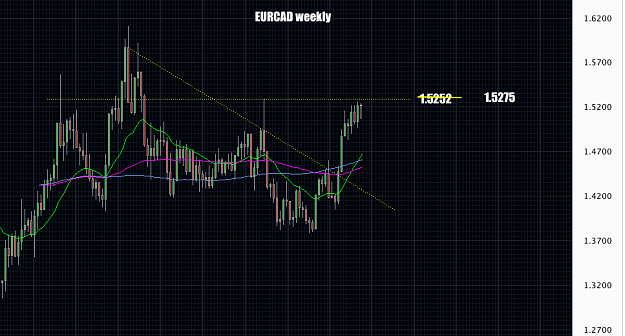
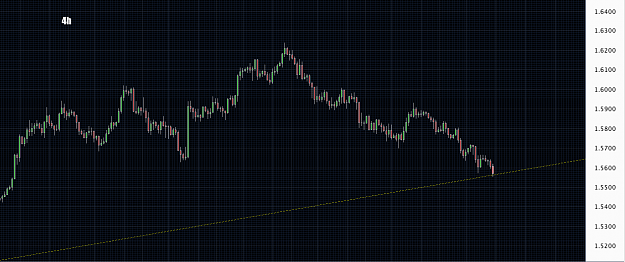
As with EURUSD, EURCAD is reaching a good level (Resistance) however on 4h I haven't got a green light just yet I'll stick with my EURUSD short. If EURCAD falls from here the probability of falling further down to 200EMA yellow line is a lot higher than it was yesterday, we're talking hundreds of pips here.
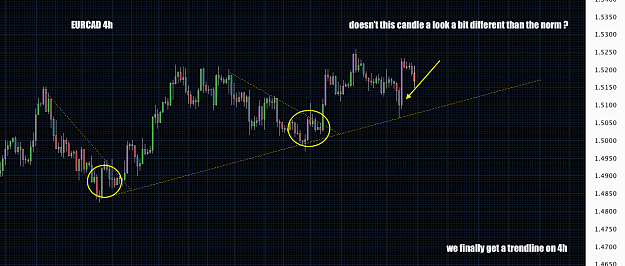
I was early although we a had bearish candle with a wick close below 4h 20ema things aren't looking too good for the bears just yet on 4h it could go up a bit before falling down or it could shoot up through that weekly level (which would take a lot of back up, I doubt it) but nevertheless since my SL is just 10pips away from the 4h HH I thought I'll play it cautiously. And since when EURUSD moves much during Asia especially with election ahead.
I'll be back when the 4h candle completes that it 6:00GMT.
Today's going to be an eventful day for EUR and GBP crosses. I doubt we'll see much movement until London open on days like this asia usually don't initiate anything.
I don't see any setup thats worth trading either on 4h and daily except for EURUSD, EURGBP, EURCAD.
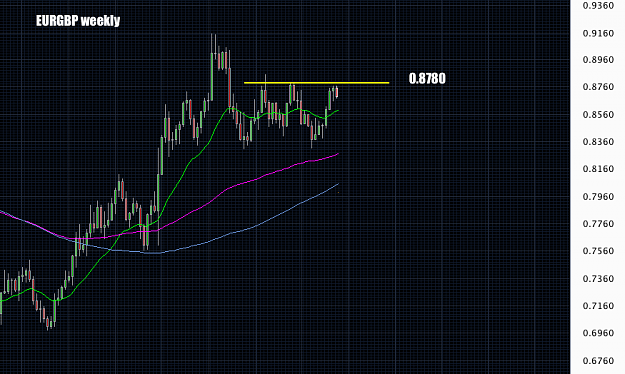
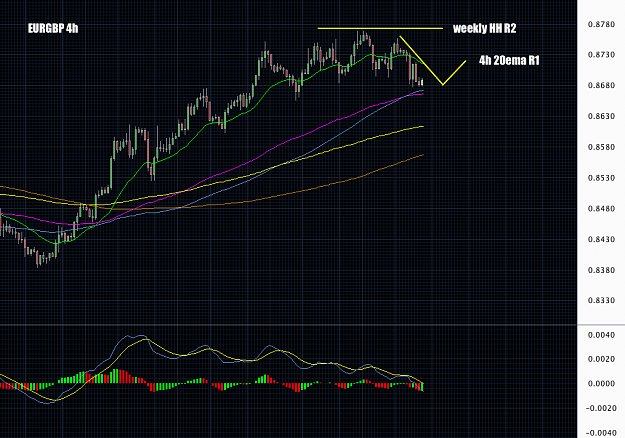
however you look at euro crosses they look bearish to me. EURGBP went down much faster and much further than its counterparts currently sitting at 4h 100SMA/EMA I'm expecting a bit of a bounce back to R1 if it finds resistance there we go further down to 4h 200EMA if it surges higher we may find resistance at weekly previous HH 0.8780, another major area to look out for. Unlike EURCAD or EURUSD , so far this weeks candle seem to be tilting towards the bearish candle.
I have a bad feeling, EURUSD is either going up or on standstill mode until much dreaded Mr.Draghi, and UK election comes along later tonight. I'm staying out.
I really have no idea what to expect from Draghi or the statement. But the levels were there and I saw a setup so that's that. On rate hike debate I think we'll see a hold on, I don't think its time yet. RBA is expected to be on hold for 2 years at least, EU isn't doing a whole lot better than them. But the general tone seems to be positive across the globe, economies recovering steadily and slowly. I'll check on my position every hour if things looking bad I'll shut it off before it hits my SL.
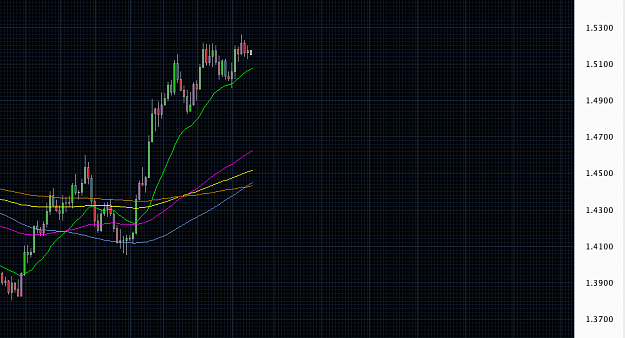
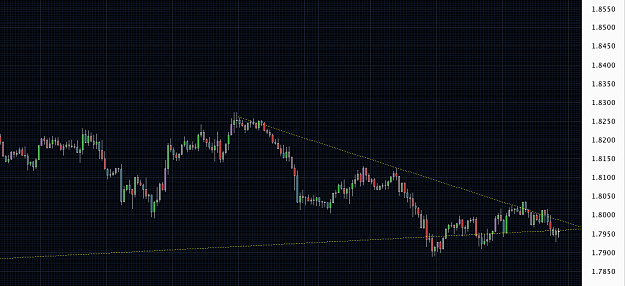
I don't know why but I just wanted to take a look at a naked chart. Never traded one always had indicators lined up. I was actually getting really comfortable with indicators. But I'm going to look at naked charts I'll start with weekly, daily, 4h and will be attempting entries on 1h. God bless me.
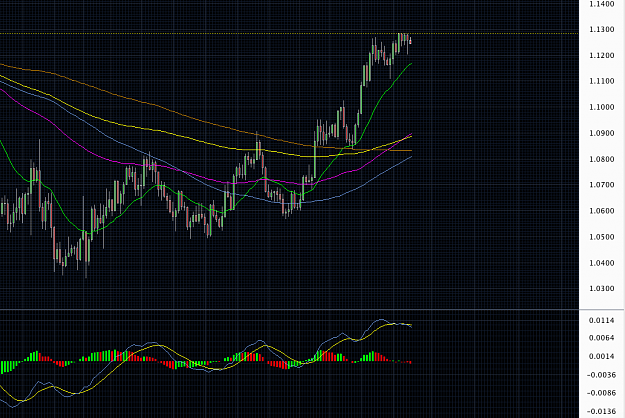
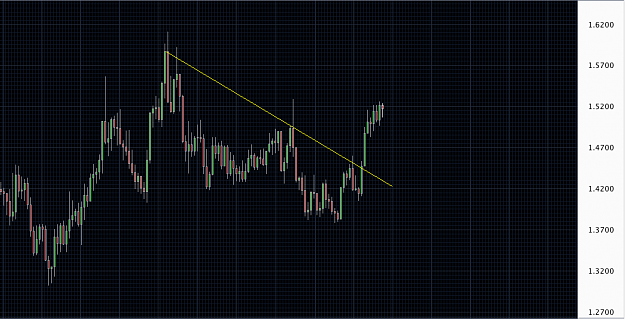
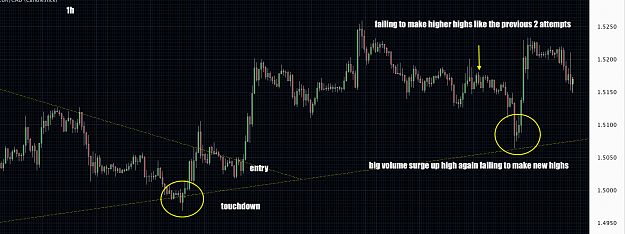
I was looking through naked charts drawing trend lines anywhere I saw them and looked at patterns and candles itself, and I saw something I've never seen before. For the first time in 3.6 years I think I'm finally on the verge of grasping how price actually moves or dances whatever you want to call it I'll call it "flow". Price actually do move in trend lines than just rigid horizontal line where we conveniently mark them as support and resistance like they're made of some steel substance that's unbreakable. Unfortunately that's never the case especially with horizontal S&R. This may be a fool's gold for someone but for me this was truly an eyeopener. And you can actually trade the combination of these trend lines on multiple TFs starting from weekly getting the big picture down to daily, 4h and making your entries on 1h, precision entry can be done this way. Let me show you an example.
I'm out of EURUSD short at -0.81$ btw. I promise I won't be opening anything for today or maybe tomorrow.
its a short however you look at it. With or without the indicators but I'm enjoying naked charts you get a clarity your screen is as cluttered with the indicators. You pay more attention to little details on the price, patten and the volume of the candles.
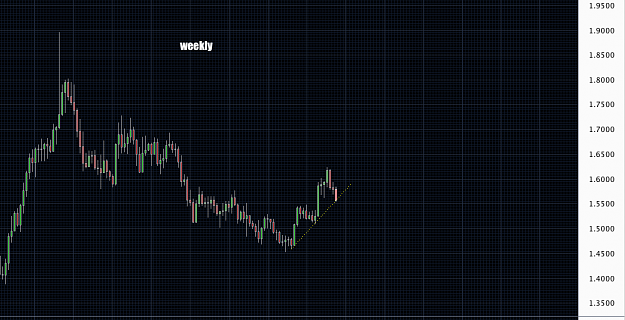
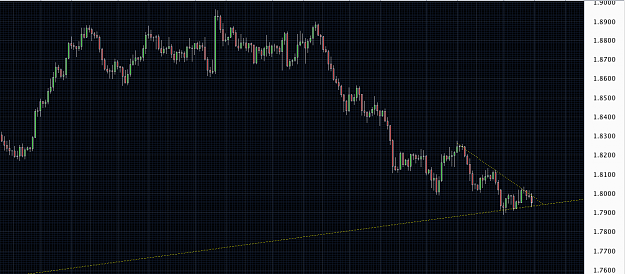
its been going up on weekly since finding bottom (double) now as we're closing the bottom of the channel we're seeing some bounce off on 1h. I'll wait on a break out to the upside and double test on 1h. I wouldn't be opening any live position however until the end of the election on Draghi.