Hi to everyone. I was just doing some personal research with the charts and I found something that left me astonished. I knew price and time relations with fibonacci, put trend angles... That is new for me. It's truly incredible how everything ends up in the sequence.
Here is an example I found recently with the trend in EURAUD pair. I would like to know what you think about this, and if I am seeing something that was long known. Hope you find it interesting!
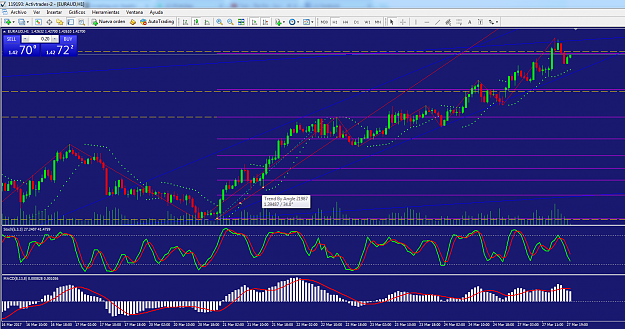
Here is our first wave, finding support at 34º (21+13)
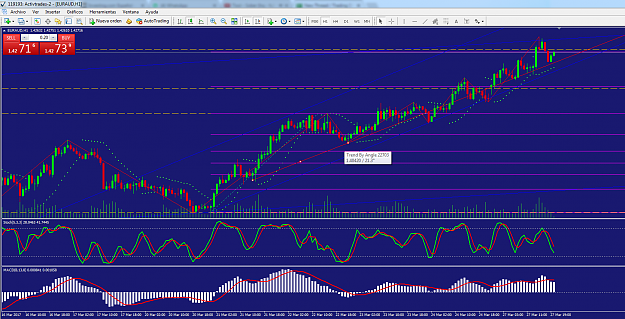
From it, the next support is found at the 21º line.
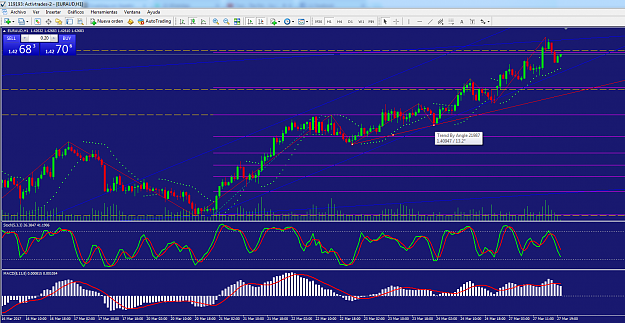
Next is 13º support.
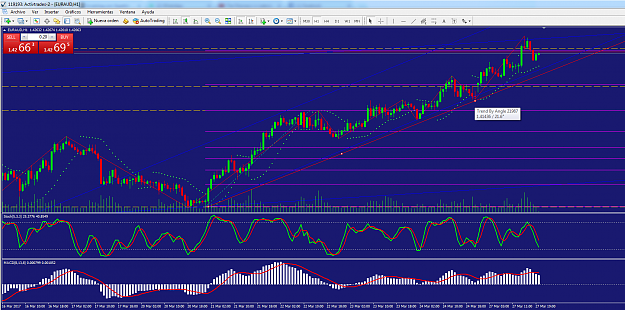
This shows the latest turning point, resting roughly in the 21º line from the origin, marking our channel boundary.
Here is an example I found recently with the trend in EURAUD pair. I would like to know what you think about this, and if I am seeing something that was long known. Hope you find it interesting!
Attached Image (click to enlarge)
Here is our first wave, finding support at 34º (21+13)
Attached Image (click to enlarge)
From it, the next support is found at the 21º line.
Attached Image (click to enlarge)
Next is 13º support.
Attached Image (click to enlarge)
This shows the latest turning point, resting roughly in the 21º line from the origin, marking our channel boundary.
Faith in the chaos