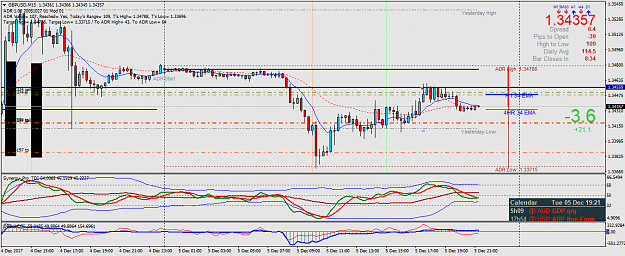
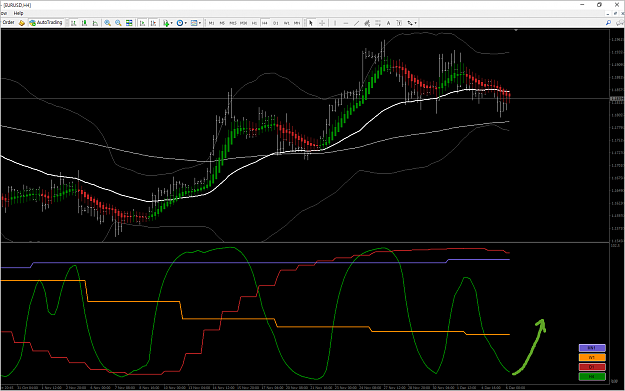
short entered as soon as price dipped below the 10 ema...I was thinking of catching it at the 34 ema on H4 but not to worry , will add if needed..let's see {image}
Ignored
added 2 entries at/near the level plotted on my chart and taken 1 out for some profits...will keep these trades o/night if need be
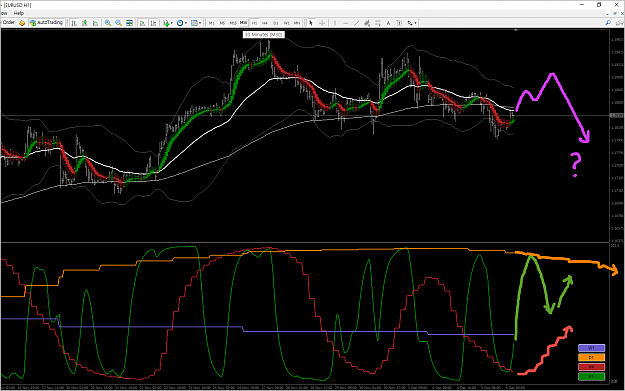
{quote} guess you took a look at the monthly..I seldom use the monthly as I am on 5,15 min tf and my method requires me to pay attention to the hourly and H4 mainly.. {image}
Ignored
there was a nice play with divergence and the 10/34 ma on the 15 min...I was in g/u so did not take it
Joined Aug 2012
|
Status: Member
|17,482 Posts|
Online Now
Morning Justin. Just saw your post. Mind telling me the method you use in your trading .From what others told me when I started trading was the easiest pairs to trade are e/u and u/y .Since you trade mainly e/u why don't you post a trade and we both can go through it without the trolls following me on other threads
Morning Justin. Just saw your post. Mind telling me the method you use in your trading .From what others told me when I started trading was the easiest pairs to trade are e/u and u/y .Since you trade mainly e/u why don't you post a trade and we both can go through it without the trolls following me on other threads
Ignored
Hi, Eric
I am not really focused on any specific system. I have tried Genesis, TMS and Alien's, and I think trend following systems are more or less the same. They have similar strengths and weaknesses. I adopted ideas here and there and made my own system which fulfills my trading psychology. I don't say I am a profitable trader. I gave up (at least for now) becoming a full-timer, and now trading is only a hobby to me. Yes, we can share our trading ideas and charts occasionally. That will be fun. For the time being, I have some DD in EU, and only managing current positions....
Simplicity is the ultimate sophistication - Leonardo da Vinci
Joined Aug 2012
|
Status: Member
|17,482 Posts|
Online Now
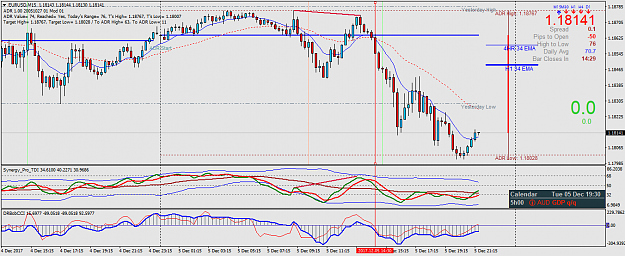
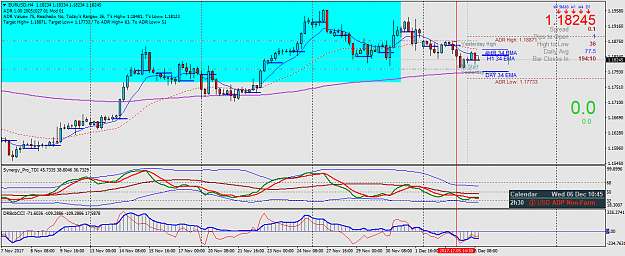
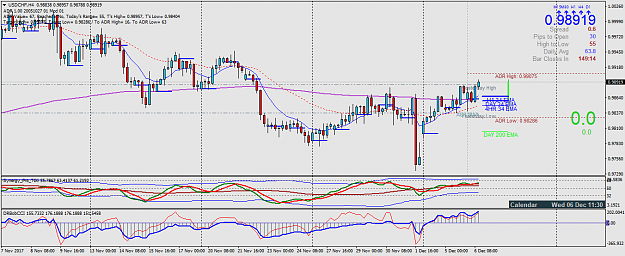
here's the 4 hour chart...the last candle was bearish but small and price is close to the 200 ema ( about 27 pips)..I f I am looking for 15-20 pips I might take a short..also do check out the swissy when you trade e/u
Joined Aug 2012
|
Status: Member
|17,482 Posts|
Online Now
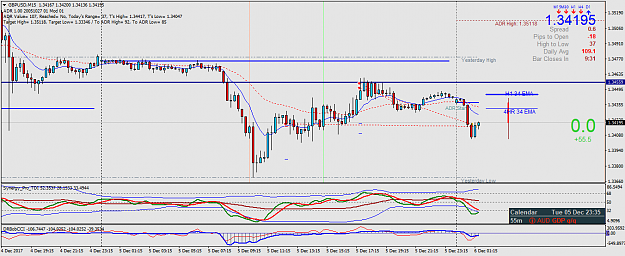
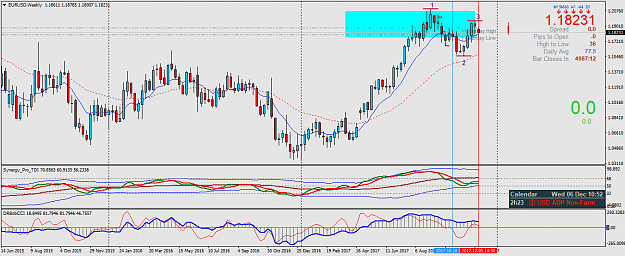
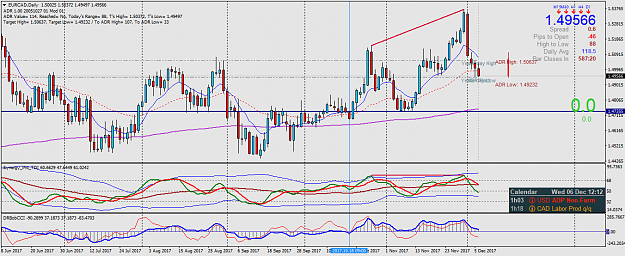
If you look at last week, pa looks like topping out ending in a doji/hammer..a 1-2-3 pattern is looking likely too and this would be massive on a weekly chart..I am just sharing what I see..hope you are not offended
here's the 4 hour chart...the last candle was bearish but small and price is close to the 200 ema ( about 27 pips)..I f I am looking for 15-20 pips I might take a short..also do check out the swissy when you trade e/u {image}
Ignored
Yes, at the moment, EU looks a bit bearish but bulls can come out again anytime. People say EUR is still cheap and have much room for going up. When we see a decent Daily bull candle, then 1.2 is still very much possible... Tricky market.
Simplicity is the ultimate sophistication - Leonardo da Vinci
If you look at last week, pa looks like topping out ending in a doji/hammer..a 1-2-3 pattern is looking likely too and this would be massive on a weekly chart..I am just sharing what I see..hope you are not offended {image}
Ignored
Good point! But won't it want to test double top before it goes up or down? If that double top cannot resist bulls, then it will go much much higher. I also worry that it tested WK 200 EMA once, and bounced up from it. If 200 EMA divides bull/sell polarity, it's still in bull side... By the way, I have sell positions with DD....
Simplicity is the ultimate sophistication - Leonardo da Vinci
Joined Aug 2012
|
Status: Member
|17,482 Posts|
Online Now
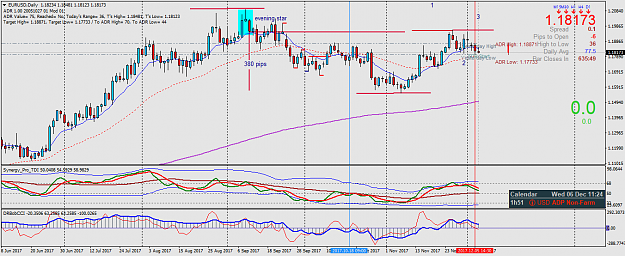
I have mentioned about the evening star in the other thread and it played out for 380 pips and I also mentioned about the top being made for the rest of the year..here's the chart..Can you let me know how to post a chart from another thread..it will save me a lot of time and hazzle having to redo the chart again
{quote} Yes, at the moment, EU looks a bit bearish but bulls can come out again anytime. People say EUR is still cheap and have much room for going up. When we see a decent Daily bull candle, then 1.2 is still very much possible... Tricky market.
Ignored
Don't listen to other people..Just look at your charts..don't follow the herd mentality..that's what you do when you are manipulating a stock..I know this very well
Joined Aug 2012
|
Status: Member
|17,482 Posts|
Online Now
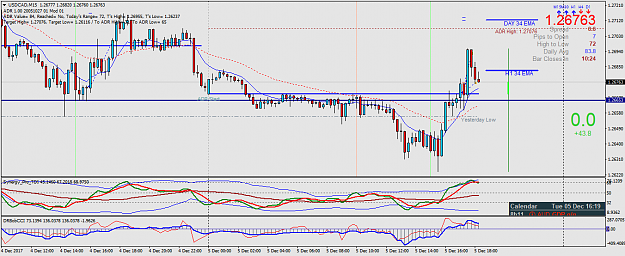
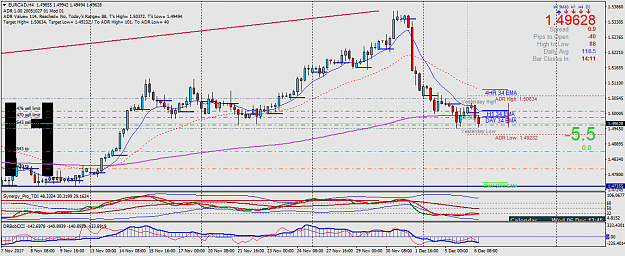
the move south is still in play unless BOC rate data changes this completely, otherwise, I see price going down to the s/r on my chart and possibly the 200 ema
the move south is still in play unless BOC rate data changes this completely, otherwise, I see price going down to the s/r on my chart and possibly the 200 ema {image}
Ignored
taken an entry with another 2 pending limits above..I have to leave the house soon and so will not be able to trade cad data..let's see how it develops..
I have mentioned about the evening star in the other thread and it played out for 380 pips and I also mentioned about the top being made for the rest of the year..here's the chart..Can you let me know how to post a chart from another thread..it will save me a lot of time and hazzle having to redo the chart again {image}
Ignored
I am not an expert but as far as I know, to display the image, copying the URL won't work. I think you need to save it as a local copy and reinsert it into the new place...i am afraid.
Simplicity is the ultimate sophistication - Leonardo da Vinci