• Home
  • Forums
  • Trades
  • News
  • Calendar
  • Market
  • Brokers
  • Login
  • Join
  • User/Email: Password:
  • 7:12am
Menu
  • Forums
  • Trades
  • News
  • Calendar
  • Market
  • Brokers
  • Login
  • Join
  • 7:12am
Sister Sites
  • Metals Mine
  • Energy EXCH
  • Crypto Craft

Options

Bookmark Thread

First Page First Unread Last Page Last Post

Print Thread

Similar Threads

A New Trader's Journey to Success 11 replies

Journey to become top strategy manager 2 replies

DJXput's journal on becoming a better trader 1 reply

A newb's quest to becoming a better trader (journal) 4 replies

A Trader's (and savings) Journey 2 replies

  • Trading Journals
  • /
  • Reply to Thread
  • Subscribe
  • 30
Attachments: Channel/SR Strategy - My Journey in Becoming a Better Trader
Exit Attachments

Channel/SR Strategy - My Journey in Becoming a Better Trader

  • Last Post
  •  
  • Page 1 2 3
  • Page 1 2 3
  •  
  • Post #1
  • Quote
  • First Post: Edited Nov 3, 2016 11:11am Oct 28, 2016 2:22pm | Edited Nov 3, 2016 11:11am
  •  JAKammus
  • | Joined Mar 2016 | Status: Member | 168 Posts
1
  • Post #2
  • Quote
  • Edited at 2:41pm Oct 28, 2016 2:27pm | Edited at 2:41pm
  •  JAKammus
  • | Joined Mar 2016 | Status: Member | 168 Posts
STRATEGY: Timeframe

  1. This strategy works in any time frame combination.
  2. Start by looking for 2 close time frame combination.
  3. You need a Higher Time Frame (HTF) & Lower Time Frame (LTF).
  4. I personally use 4H/1H, most of the times.
  5. If I have time to scalp, I use 5M/1M.


  • Post #3
  • Quote
  • Oct 28, 2016 2:31pm Oct 28, 2016 2:31pm
  •  JAKammus
  • | Joined Mar 2016 | Status: Member | 168 Posts
STRATEGY: Pairs

  1. You can use this strategy in any pair.
  2. Some pairs I consider the "fundamental analysis". For instance, the GBP pairs have been bearish and all over the map. So If I decide to trade them I will use my scalping time frame combination (5M/1M).
  3. Avoid pairs that are trading wild (Ups and downs in every candle).
  4. Make sure the price is moving (I'm not talking about trends, I'm talking about flow).


  • Post #4
  • Quote
  • Oct 28, 2016 2:36pm Oct 28, 2016 2:36pm
  •  JAKammus
  • | Joined Mar 2016 | Status: Member | 168 Posts
STRATEGY: Money Management

  1. I use 2.5% per trade from my initial capital and 2.5% from my profit.
  2. Most people would recommend using no more than 2% of your capital (This is your personal decision).

Below I have a screenshot from my Excel file where I keep track of my trades. (P.S. It has been cleared out)

  1. Since there is no gains I'm risking $0 from gains and $6.25 from the initial capital of $250
  2. At the end, I have the total amount we are currently risking per trade.
  3. I also have a calculator where I type the SL and it gives me the lot I should use based on my risk profile.

Attached Image (click to enlarge)
Click to Enlarge

Name: image001.PNG
Size: 4 KB
 
 
  • Post #5
  • Quote
  • Oct 28, 2016 2:41pm Oct 28, 2016 2:41pm
  •  JAKammus
  • | Joined Mar 2016 | Status: Member | 168 Posts
STRATEGY: SL/TP

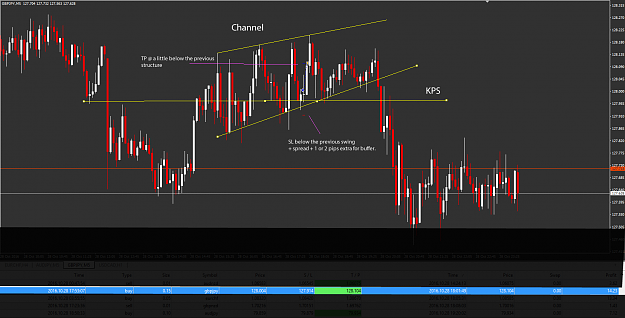
  1. Stop Loss goes before previous swing + spread + a couple of extra pips. This will depend in the pair you are trading, time frame, etc. You might consider using ATR to help guide your decision. I personally don't use it.
  2. Take Profit goes in the next price structure (I will show examples later on)
  3. No need to say that you shouldn't enter the trade if it offers less than 1:1 RR.


  • Post #6
  • Quote
  • Oct 28, 2016 2:46pm Oct 28, 2016 2:46pm
  •  JAKammus
  • | Joined Mar 2016 | Status: Member | 168 Posts
SETUP

In the next few posts I will be discussing the strategy in details. It may take me more than a day to do so.
The steps are simple and will be broken down in the next few posts.


  1. Look for Channels
  2. Find Price Structures (SR)
  3. Look for Entry-Condition
  4. Wait for a Reason-to-Entry


  • Post #7
  • Quote
  • Oct 28, 2016 3:00pm Oct 28, 2016 3:00pm
  •  JAKammus
  • | Joined Mar 2016 | Status: Member | 168 Posts
SETUP 1.Channels

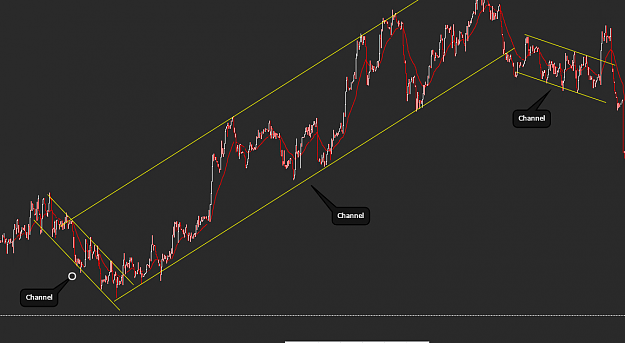
  1. To look for channels you basically connect tops and bottoms of a well developed trend in your HTF. Since I'm using the 4H/1H combination. I would look for channels in the 4H, sometimes in the Daily if I need a better view.
  2. An easy way to spot channels is to zoom out.
  3. Looking for channels is not mandatory, but it increases your odds greatly. Also, it makes it easier to spot key price structures.
  4. If I trade without using a channel, I would cut my lot by half (Risk reduction), since channels adds confluence to your reversal trades.

Attached Image (click to enlarge)
Click to Enlarge

Name: channels.PNG
Size: 73 KB
 
 
  • Post #8
  • Quote
  • Edited at 3:57pm Oct 28, 2016 3:41pm | Edited at 3:57pm
  •  JAKammus
  • | Joined Mar 2016 | Status: Member | 168 Posts
SETUP 2.Key Price Structure

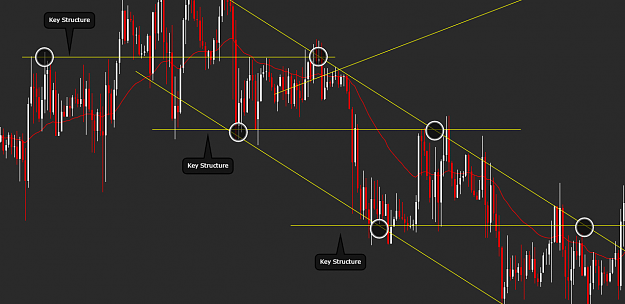
  1. Price Structure is what I call support & resistance areas.
  2. Look for Key Price Structure within your HTF

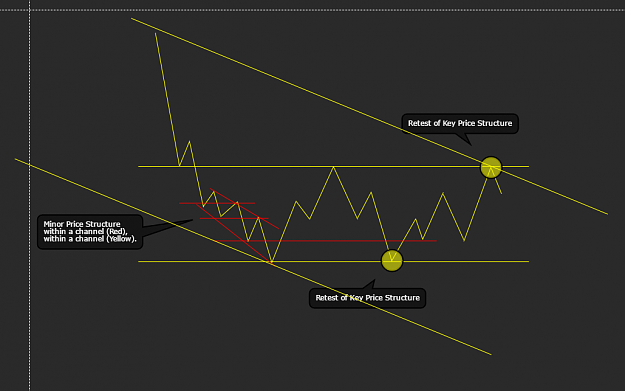
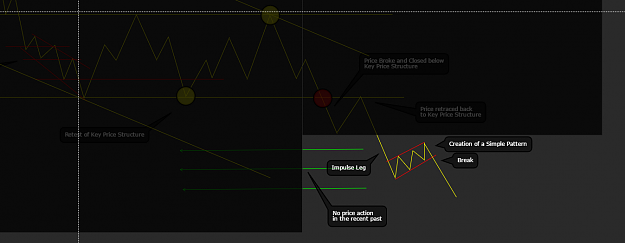
In the picture below you can see that when price touches the channel it often creates a key structure. If you look for touches in that zone shortly before you will most likely find them. That confirms that zone is a key price structure.

If you look in the future (based on the image) the price is likely to reverse in that area or break through. In either case this strategy will show how you can benefit from those opportunities.

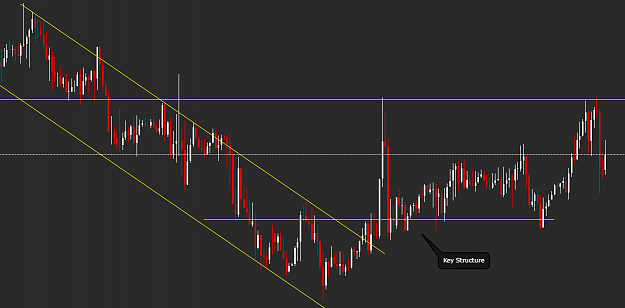
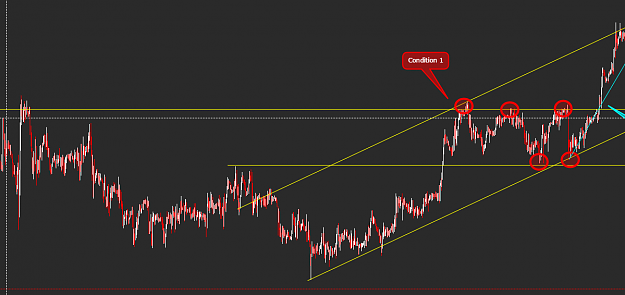
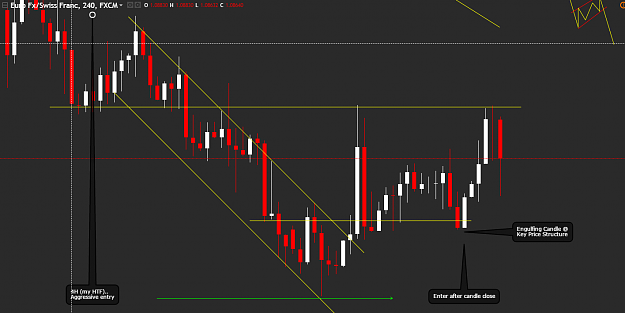
You can see in the second picture that even though price left the channel, the key price structure used by the channel is still important and relevant. Therefore it will remain valid for the near future. This example actually gave me a trading opportunity this morning in which I made 35 pips.

I will show trading examples (including this one) later on, after I finish explaining the strategy.

Attached Images (click to enlarge)
Click to Enlarge

Name: Key Structure.PNG
Size: 89 KB Click to Enlarge

Name: Capture.PNG
Size: 52 KB
 
 
  • Post #9
  • Quote
  • Oct 28, 2016 4:21pm Oct 28, 2016 4:21pm
  •  JAKammus
  • | Joined Mar 2016 | Status: Member | 168 Posts
SETUP 3.Entry-Condition

  1. Entry condition MUST happen within your HTF, in my case 4H.
  2. If you don't find an Entry-Condition, don't bother looking in your LTF.
  3. When you find an Entry-Condition, look for a Reason-to-Entry (Step 4, which is coming next)

In the picture it shows all 3 conditions.

Condition 1: Retest a Key Price Structure (Range situation)
Condition 2: Break a Key Structure (Trend situation)
Condition 3: Breakout

I will go in more detail what each condition means soon

Attached Image (click to enlarge)
Click to Enlarge

Name: conditions.PNG
Size: 75 KB
 
 
  • Post #10
  • Quote
  • Oct 28, 2016 4:33pm Oct 28, 2016 4:33pm
  •  JAKammus
  • | Joined Mar 2016 | Status: Member | 168 Posts
SETUP 3.Entry-Condition

Condition 1


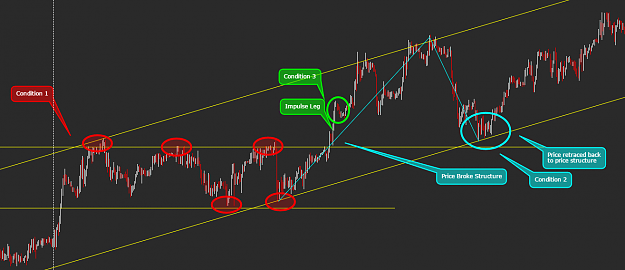
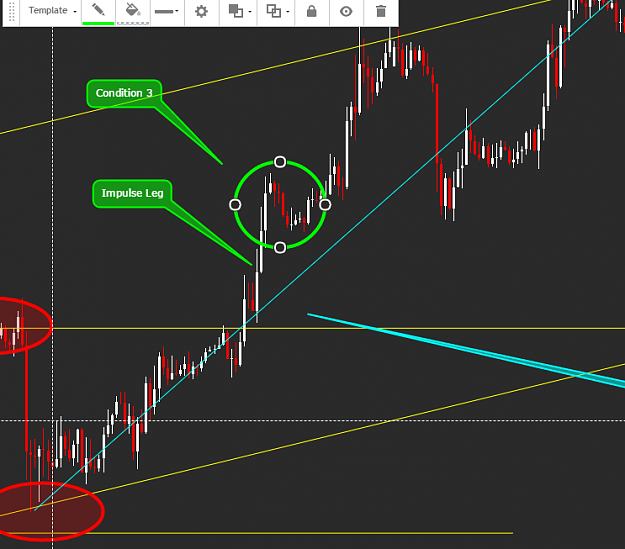
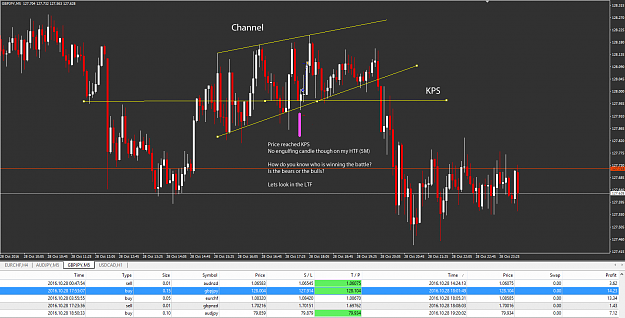
  1. In condition 1, price must have reached a Key Price Structure (First Pic - Yellow)
  2. It should not be the first touch. In other words, it should be a retest of that area (Circled in Yellow)
  3. As you can see in the red lines, we have a channel within a channel. Those areas although create Price Structure are not a Key Price Structure for the time frame combination we are using. If someone was using a smaller HTF & LTF combination they could certainly profit from it.
  4. That is not to say you can't switch from 4H/1H to 30M/5M for example. You can and certainly should. Just remember that for that time being your analysis should be kept in that time frame combination.
  5. In a lower time frame combination the red line would be a Key Price Structure.

Attached Images (click to enlarge)
Click to Enlarge

Name: condition 1 ex.PNG
Size: 46 KB Click to Enlarge

Name: condition 1.PNG
Size: 56 KB
 
 
  • Post #11
  • Quote
  • Oct 28, 2016 5:05pm Oct 28, 2016 5:05pm
  •  JAKammus
  • | Joined Mar 2016 | Status: Member | 168 Posts
SETUP 3.Entry-Condition

Condition 2

  1. In condition 2, price must have broken below/above a Key Price Structure and retraced back to it.
  2. If price is still the channel is irrelevant. In some cases price will break both the Key Price Structure AND channel.
  3. http://www.forexfactory.com/showthre...19#post9224719 (second picture shows how price broke both)
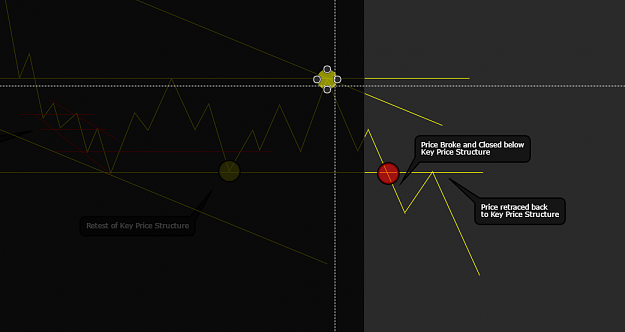
  4. Accordingly to Wyckoff, this would be the Throwback, which is usually followed by a big move (start of a new trend)
  5. For more information about the different phases research Wyckoff. (This is not required to follow this strategy). It will help you read the market a little better though. If you want more information on Wyckoff this is a good place to start: http://stockcharts.com/articles/wyckoff/

Attached Images (click to enlarge)
Click to Enlarge

Name: condition2 ex.PNG
Size: 44 KB Click to Enlarge

Name: Condition 2.PNG
Size: 56 KB
 
 
  • Post #12
  • Quote
  • Edited at 5:34pm Oct 28, 2016 5:18pm | Edited at 5:34pm
  •  JAKammus
  • | Joined Mar 2016 | Status: Member | 168 Posts
SETUP 3.Entry-Condition

Condition 3

  1. Condition 3 is similar to Condition 2. The main difference is that there is no price action when looking left.
  2. We are not looking for a retracement back to a price structure, but rather a price continuation.
  3. This condition happens after an impulse leg.

Attached Images (click to enlarge)
Click to Enlarge

Name: conditon 3 ex.PNG
Size: 58 KB Click to Enlarge

Name: Condition 3.PNG
Size: 51 KB
 
 
  • Post #13
  • Quote
  • Oct 28, 2016 6:51pm Oct 28, 2016 6:51pm
  •  JAKammus
  • | Joined Mar 2016 | Status: Member | 168 Posts
SETUP 4.Reason-for-Entry

  1. For Condition 1 & 2 we can have an aggressive or conservative entry
  2. For Condition 3, we trade the breakout. You could use 2 EMAs crossover if you choose so. I don't use them.

Aggressive Entry

  1. Look for an engulfing candle in your HTF, in my case the 4H chart (Picture 1)

Conservative Entry:
Switch to a LTF, in my case the 1H chart

  1. Enter when you see a double top/bottom followed by an engulfing candle close(Picture 2)
  2. Enter when you see a pinbar/Hanging man/etc followed by an engulfing candle close (Picture 2)


As mentioned before, for the Breakout condition you enter on the break after the candle closes. (Picture 3)

  1. In the breakout condition we are looking for simple patterns. (Picture 4), right after an impulse leg.

Attached Images (click to enlarge)
Click to Enlarge

Name: Picture1.PNG
Size: 60 KB Click to Enlarge

Name: pic2.PNG
Size: 63 KB Click to Enlarge

Name: pic4done.PNG
Size: 109 KB Click to Enlarge

Name: simple patterns.png
Size: 45 KB
 
 
  • Post #14
  • Quote
  • Oct 28, 2016 7:01pm Oct 28, 2016 7:01pm
  •  JAKammus
  • | Joined Mar 2016 | Status: Member | 168 Posts
That concludes the strategy.

The past 15 trades I took between 10/25 and 10/28 using this strategy gave me 14 winners and 1 loser.
A total profit of almost $90 dollars using a demo account of $400 risking no more than 2% on average per trade.

It could have been luck.

I will create a brand new demo account this weekend and will start trying to duplicate it on Monday.
After that, as I mentioned before, I will only show live trades.
In the mean time I will continue to trade using my live account using the best setups and will try sharing it here.

I will post trades I took today over the weekend using this strategy.
 
 
  • Post #15
  • Quote
  • Oct 29, 2016 7:33am Oct 29, 2016 7:33am
  •  coralsands
  • | Joined Jul 2016 | Status: Member | 22 Posts
Wow, what a very nice description of your trading system, with great pictures. This is very helpful. Sometimes I trade channels as well. I wonder if having the major Support and Resistance lines (from past months and years) would help your system, or not. To clarify, it seems that most of your observation takes place in the higher timeframe, even your entry criteria. What then was the purpose of using the lower TF?
Again, thanks for the wonderful posts.
 
 
  • Post #16
  • Quote
  • Oct 29, 2016 8:00am Oct 29, 2016 8:00am
  •  coralsands
  • | Joined Jul 2016 | Status: Member | 22 Posts
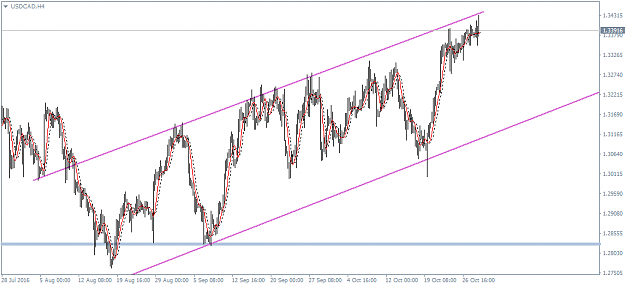
Regarding major S + R. Here is a recent example of the USDCAD with a channel on 4H chart.

Attached Image (click to enlarge)
Click to Enlarge

Name: USDCADH4.png
Size: 31 KB


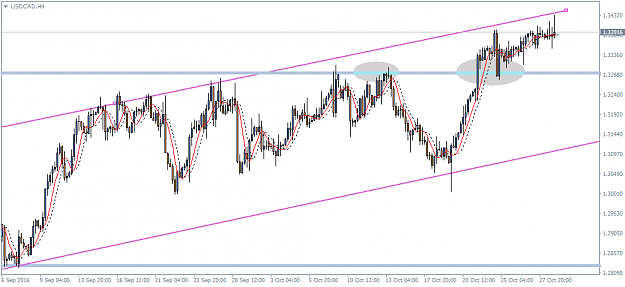
Now, if we draw in the Major S +R (from over 20 years of history) you can see how price reacted to it in shaded ovals. First, it bounced a couple of times, then broke thru, then used it as Support, but also continues to stay within bounds of upper channel.

Attached Image (click to enlarge)
Click to Enlarge

Name: USDCADH4-2.png
Size: 31 KB
 
 
  • Post #17
  • Quote
  • Oct 29, 2016 9:49am Oct 29, 2016 9:49am
  •  JAKammus
  • | Joined Mar 2016 | Status: Member | 168 Posts
Quoting coralsands
Disliked
Wow, what a very nice description of your trading system, with great pictures. This is very helpful. Sometimes I trade channels as well. I wonder if having the major Support and Resistance lines (from past months and years) would help your system, or not. To clarify, it seems that most of your observation takes place in the higher timeframe, even your entry criteria. What then was the purpose of using the lower TF? Again, thanks for the wonderful posts.
Ignored
Thank you for your kind words. I hope it helps your trading.

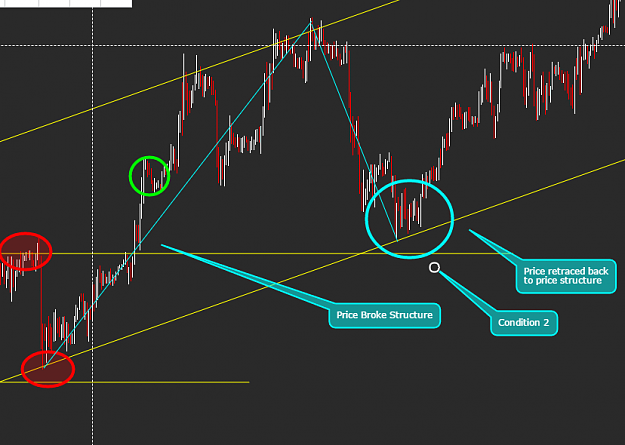
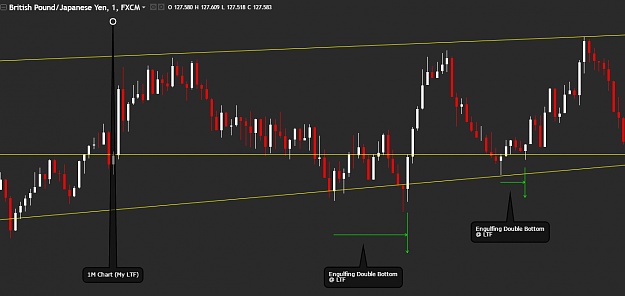
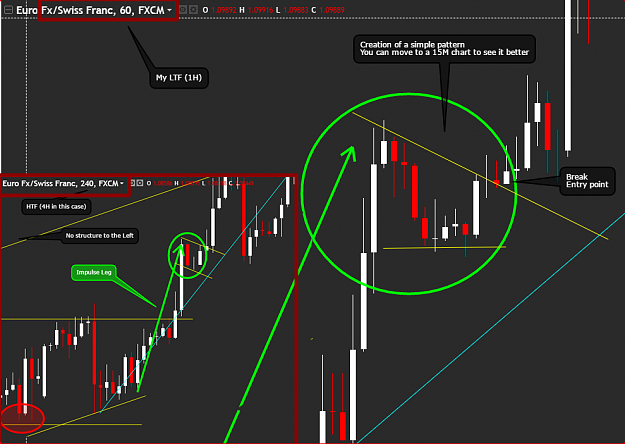
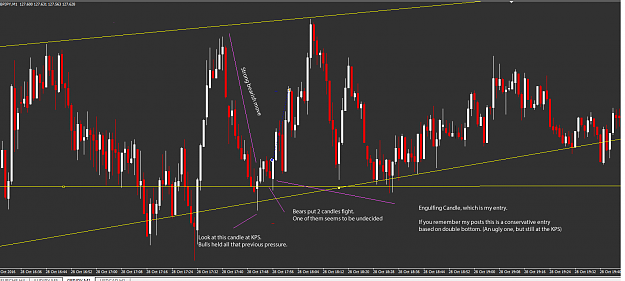
Most of my trades I take from the aggressive entry, which uses my HTF. In certain cases though, you will see price will reach your key structure but not give you an engulfing candle right after. How would you know that the price will reverse if you don't have that candle? If it doesn't give you the engulfing candle, is likely that the key structure will not hold the price, and will just keep moving. That is when I switch to my LTF. There I can analyse if price will break or hold. You still cannot know for certain what price will do, but it will increase your probabilities of understanding what prices might do.

Let me share one of my trades yesterday to show what I mean. It gave me 10 pips in 5 minutes.

In regards to your charts, you are spot on. Thanks for sharing by the way. I do use past history when trading my Key Price Structure. I just don't draw them because my chart would become a mess lol. So I draw a trend line horizontally. You can't see that I took the past into consideration, but you are right. That adds to your probabilities IMHO.

Thank you for passing by. I encourage you to stay around sharing your channels and trades if you use similar setup. That would help me and others that would like to trade this way. We can't keep track of all pairs and time frames lol.

Take care.
Attached Images (click to enlarge)
Click to Enlarge

Name: 20161028-GBPJPY-HTF.png
Size: 52 KB Click to Enlarge

Name: 20161028-GBPJPY-LTF.png
Size: 33 KB Click to Enlarge

Name: 20161028-GBPJPY-MM.png
Size: 52 KB
 
 
  • Post #18
  • Quote
  • Oct 29, 2016 10:16am Oct 29, 2016 10:16am
  •  coralsands
  • | Joined Jul 2016 | Status: Member | 22 Posts
Thanks for the clarification, now I understand your MTF analysis. I hope to stay around and contribute and help each other. I will probably stick to higher TF's like 4H, Daily, and possibly 1H for entry, simply because of my work schedule. I'm not near the computer all day, but when I get a chance hopefully I can post.

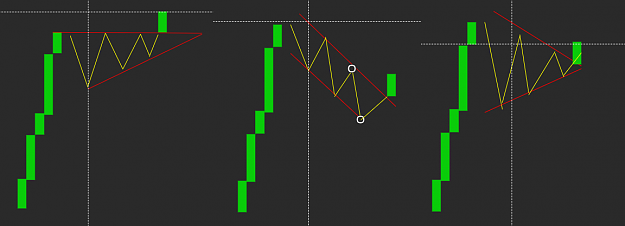
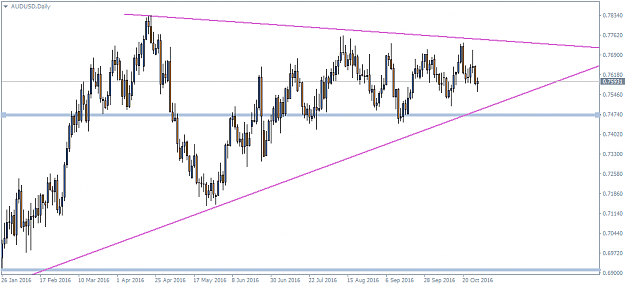
Also, I don't know if you're into triangle formations (which to me are similar to a channel, they just constrict on one end and usually result in a breakout), but there is a large ascending triangle formation on the AUDUSD Daily charts with major resistance below. Something to keep an eye on.

Attached Image (click to enlarge)
Click to Enlarge

Name: AUDUSDDaily.png
Size: 27 KB
 
1
  • Post #19
  • Quote
  • Oct 29, 2016 10:19am Oct 29, 2016 10:19am
  •  JAKammus
  • | Joined Mar 2016 | Status: Member | 168 Posts
That's the beauty of this strategy. Can be used in any time frame. I do trade triangles. I love them lol. Thanks for sharing that one. I will keep an eye on it. Usually it offers quick profits.
 
 
  • Post #20
  • Quote
  • Oct 29, 2016 10:40am Oct 29, 2016 10:40am
  •  siawling
  • | Joined Jun 2015 | Status: Member | 35 Posts
SUBSCRIBED !!!

I LOVE THIS STRATEGY ... THANKS FOR SHARING.
 
 
  • Trading Journals
  • /
  • Channel/SR Strategy - My Journey in Becoming a Better Trader
  • Reply to Thread
    • Page 1 2 3
    • Page 1 2 3
0 traders viewing now
  • More
Top of Page
  • Facebook
  • Twitter
About FF
  • Mission
  • Products
  • User Guide
  • Media Kit
  • Blog
  • Contact
FF Products
  • Forums
  • Trades
  • Calendar
  • News
  • Market
  • Brokers
  • Trade Explorer
FF Website
  • Homepage
  • Search
  • Members
  • Report a Bug
Follow FF
  • Facebook
  • Twitter

FF Sister Sites:

  • Metals Mine
  • Energy EXCH
  • Crypto Craft

Forex Factory® is a brand of Fair Economy, Inc.

Terms of Service / ©2022