Can't seem to find this anywhere on the interweb so thought I'd create a post here to explain my strategy.
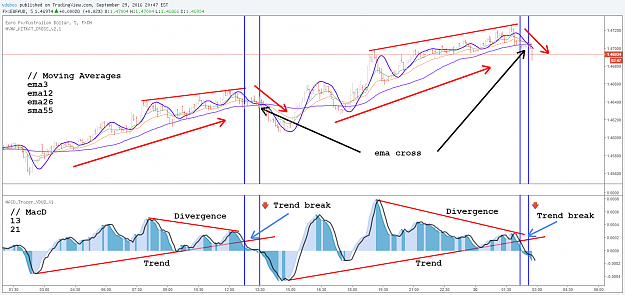
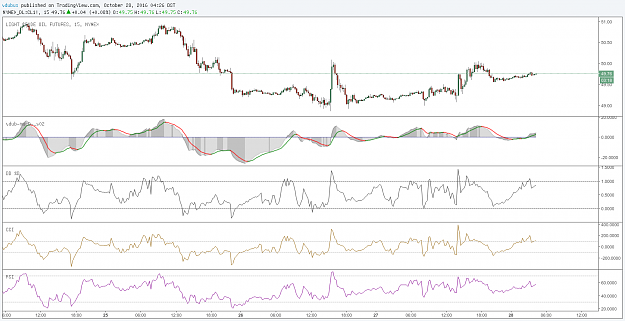
You can use pretty much any of the lower indicators but I find the Stochastic, BB% and / macD works the best.
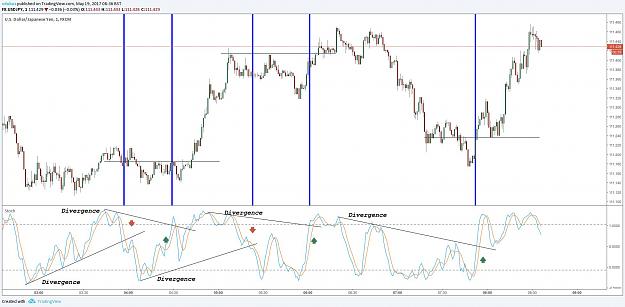
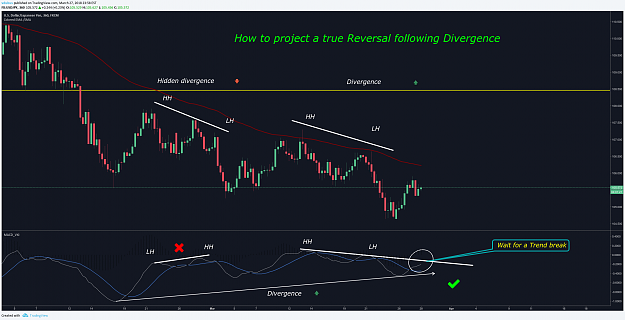
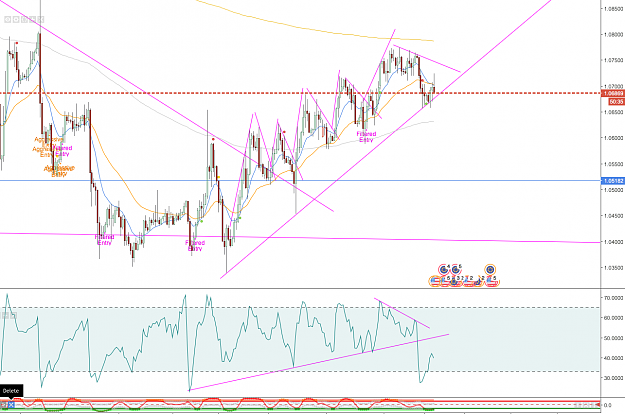
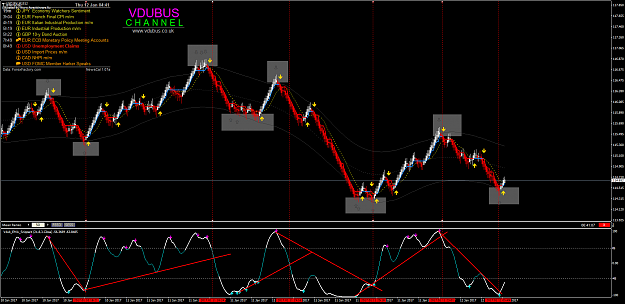
We all know the use of these indicators to find divergence but the cross over pivots are almost never the true reversal points.
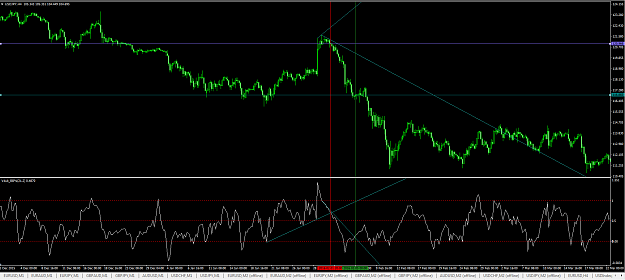
The true reversals / breakouts can be determined by drawing in a simple trend line.
Rules.
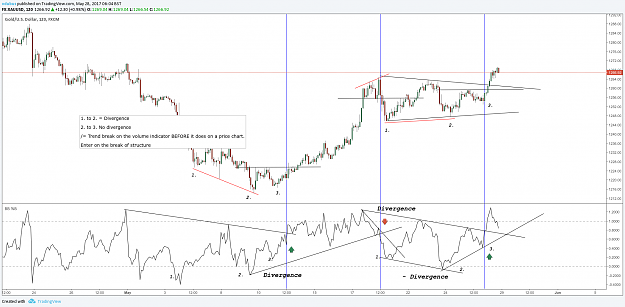
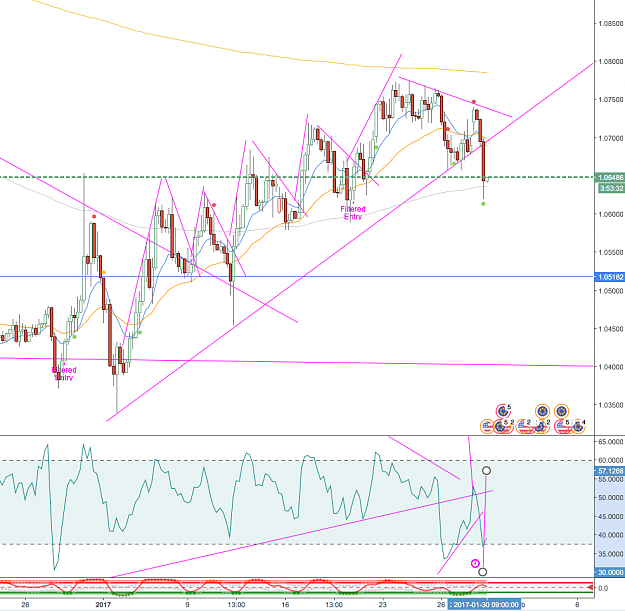
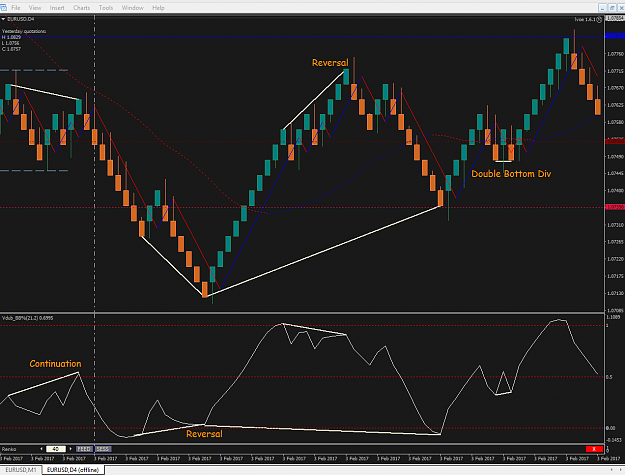
Previous Divergence Projects the next trend break / reversal
1. to 2. = Divergence
2. to 3. No divergence
/= Trend break on the volume indicator BEFORE it does on a price chart.
Enter on the break of structure
-----------------------------
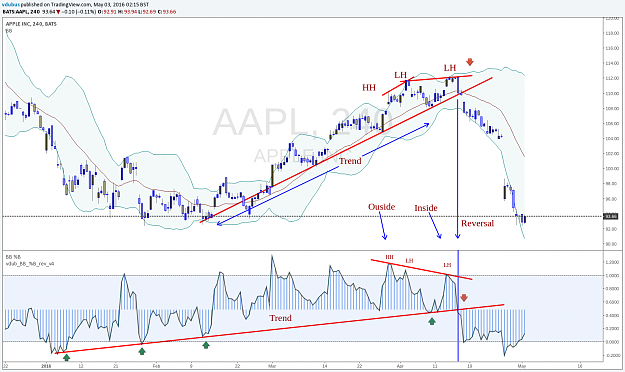
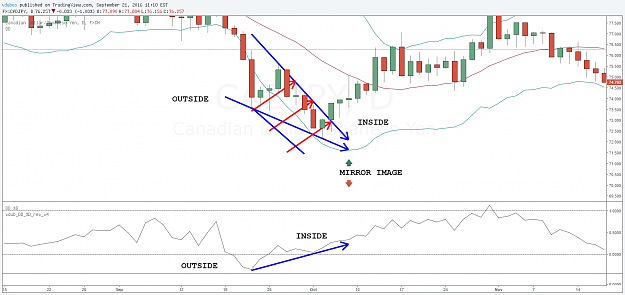
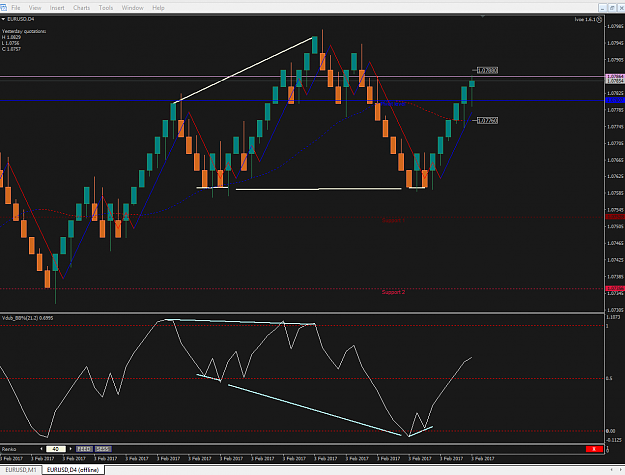
When using the BB% indicator the same rules apply as if you are using a simple Bollinger Band.
Rules.
1/ Mark the highs (or lows) Outside of the bolinger band then the Inside. Usually the following inside high is higher than the outside high which
relative to the bollinger band indicates a reversal. Remove the bollinger bands this is divergence. The BB% indicator mirrors the Bollinger band.
I can better explain this with pictures.
Hope this helps a few peeps
enjoy
You can use pretty much any of the lower indicators but I find the Stochastic, BB% and / macD works the best.
We all know the use of these indicators to find divergence but the cross over pivots are almost never the true reversal points.
The true reversals / breakouts can be determined by drawing in a simple trend line.
Rules.
Previous Divergence Projects the next trend break / reversal
1. to 2. = Divergence
2. to 3. No divergence
/= Trend break on the volume indicator BEFORE it does on a price chart.
Enter on the break of structure
-----------------------------
When using the BB% indicator the same rules apply as if you are using a simple Bollinger Band.
Rules.
1/ Mark the highs (or lows) Outside of the bolinger band then the Inside. Usually the following inside high is higher than the outside high which
relative to the bollinger band indicates a reversal. Remove the bollinger bands this is divergence. The BB% indicator mirrors the Bollinger band.
I can better explain this with pictures.
Hope this helps a few peeps
enjoy
Attached Image(s) (click to enlarge)