IN A RETRACEMENT, PRICE WILL NEARLY ALWAYS RETURN TO ITS PREVIOUS HIGH OR LOW, EXCEPT WHEN CHANGING DIRECTION.
INSIDE EVERY SIMPLE RETRACE ON A LARGER TIME FRAME IS A COMPOUND RETRACE ON A SMALLER TIME FRAME
So lets put this altogether and come up with a tradeable method.
Our first step is to find a Simple retracement, on any T/F 5m or above. We have learnt from above that a Simple Retracement is one where in a CLEAR trend we can see a reversal consisting mostly of the same colour candles. So on a down trend we would be looking for usually 3 or more Green candles form in the opposite direction of the prevailing trend, when you see a small Red candle that has formed change your T/F down until you can see a reasonably well formed compound trend forming.
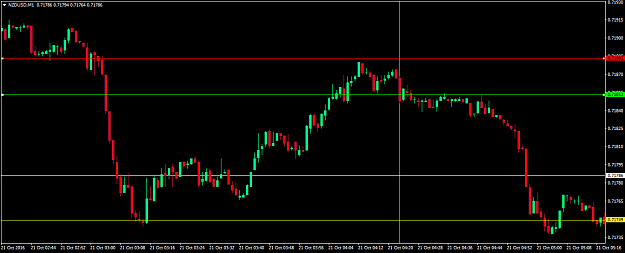
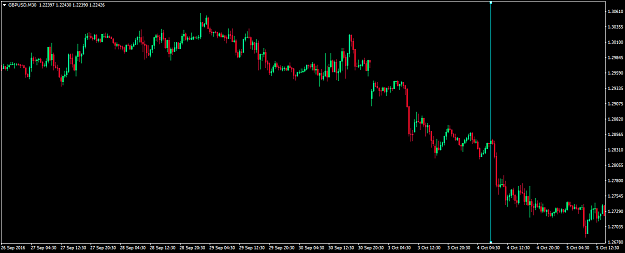
Below is a recent example on NZ/US , starting on a 15m chart then going to a 5m and then a 1m chart where you can clearly see the finished Compound Trend.
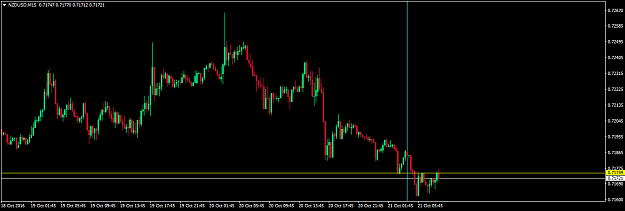
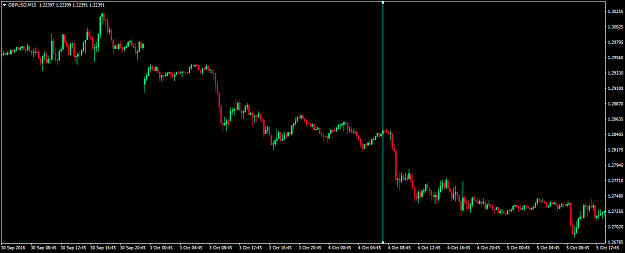
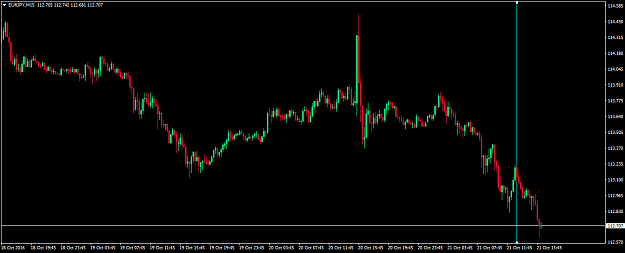
As you can see this this chart has nice clean discernable trend, the retracement with the vertical line thru it shows all the properties that we are looking for in a Simple retracement - 3+ candles green in colour going in the opposite direction of the prevailing trend. This is a 15m. When we see a small red candle close we go down to a smaller T/F until we can see a well formed Compound Retracement.
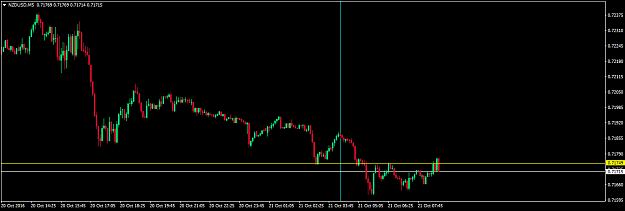
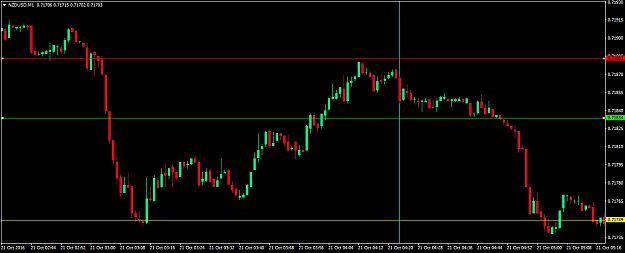
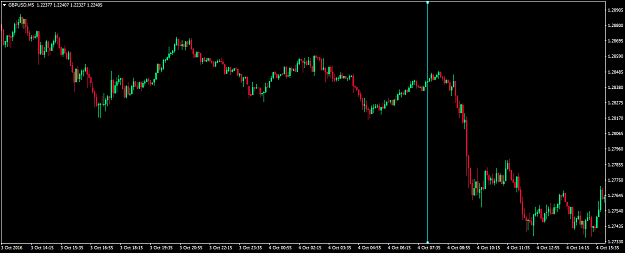
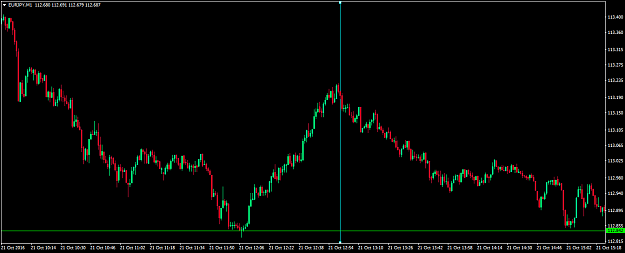
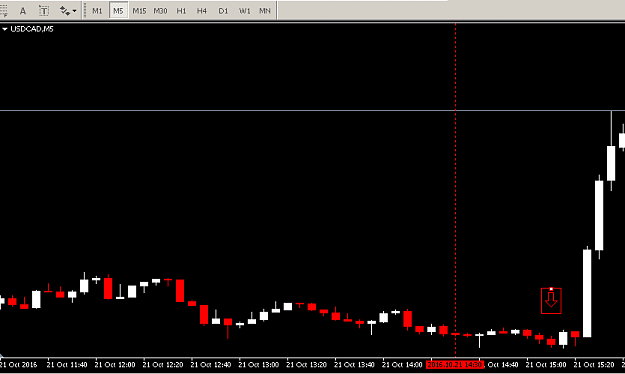
Here we have gone down to 5m of the same retracement, you can see that small waves are starting to form, but not significant enough to say it is a well formed Compound Retrace, so we go down 1 more T/F.
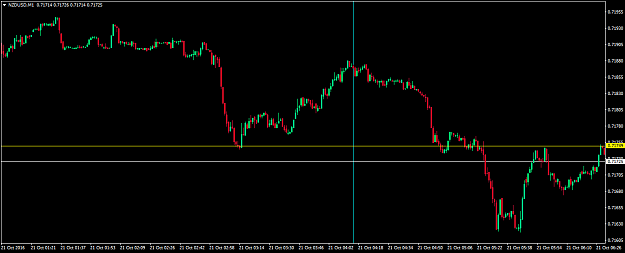
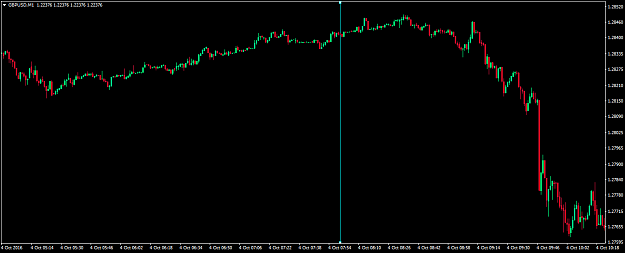
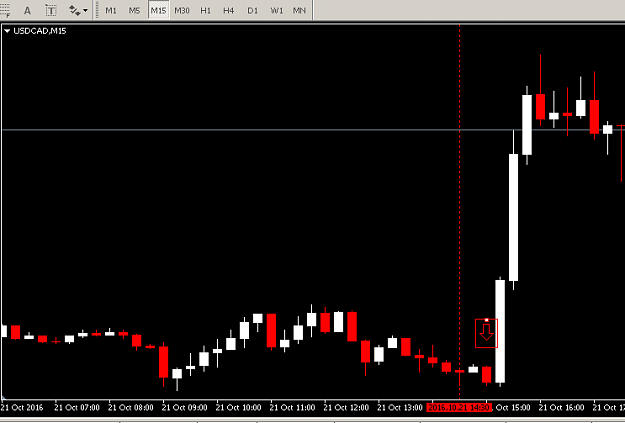
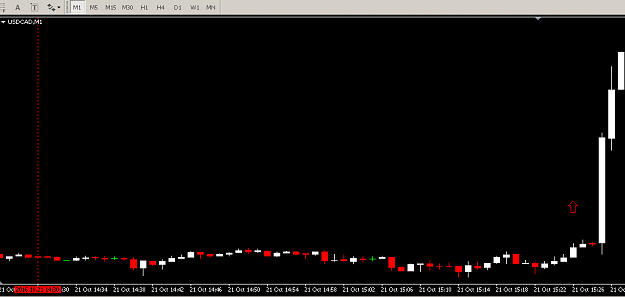
At 1m T/F you can now see a nicely formed Compound trend with clear waves up and down
INSIDE EVERY SIMPLE RETRACE ON A LARGER TIME FRAME IS A COMPOUND RETRACE ON A SMALLER TIME FRAME
So lets put this altogether and come up with a tradeable method.
Our first step is to find a Simple retracement, on any T/F 5m or above. We have learnt from above that a Simple Retracement is one where in a CLEAR trend we can see a reversal consisting mostly of the same colour candles. So on a down trend we would be looking for usually 3 or more Green candles form in the opposite direction of the prevailing trend, when you see a small Red candle that has formed change your T/F down until you can see a reasonably well formed compound trend forming.
Below is a recent example on NZ/US , starting on a 15m chart then going to a 5m and then a 1m chart where you can clearly see the finished Compound Trend.
Attached Image (click to enlarge)
As you can see this this chart has nice clean discernable trend, the retracement with the vertical line thru it shows all the properties that we are looking for in a Simple retracement - 3+ candles green in colour going in the opposite direction of the prevailing trend. This is a 15m. When we see a small red candle close we go down to a smaller T/F until we can see a well formed Compound Retracement.
Attached Image (click to enlarge)
Here we have gone down to 5m of the same retracement, you can see that small waves are starting to form, but not significant enough to say it is a well formed Compound Retrace, so we go down 1 more T/F.
Attached Image (click to enlarge)
At 1m T/F you can now see a nicely formed Compound trend with clear waves up and down
patience is bitter, but its fruit is sweet
2