Hi Guys,
So far, MA ribbons were cluttering your charts, hiding candles and useful informations, they had an awful look on your chart when you were zooming they were looking like that:
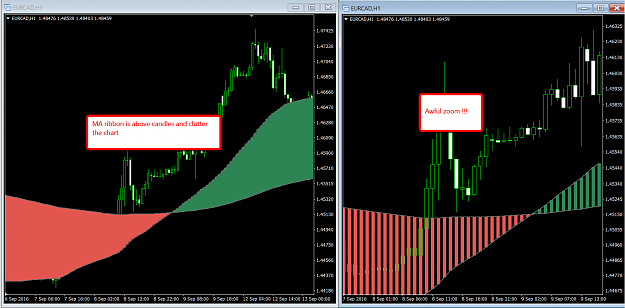
Now comes this innovative tool which displays the ribbons in a complete different way.
This tool has 9 different modes:
Display 1 MA
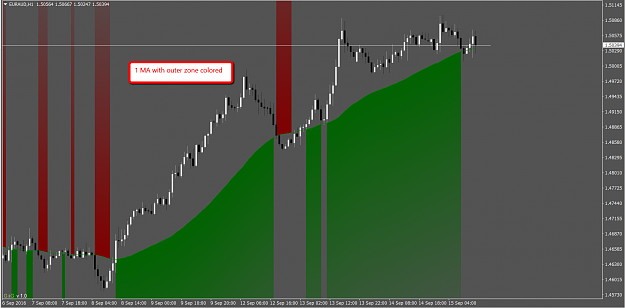
- Display 1 MAs and colour the outer part of the chart (below/above MA)
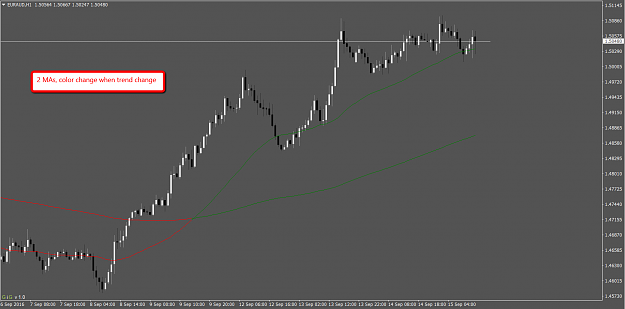
- Display 2 MAs
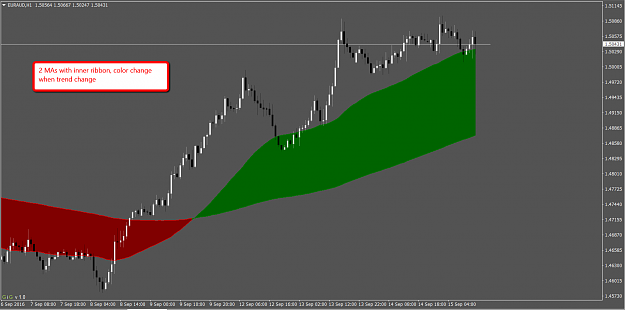
- Display 2 MAS with inner ribbon
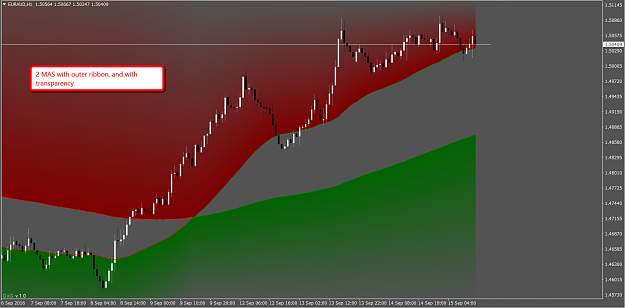
- Display 2 MAS with outer ribbon
- Display Central TMA
- Display Central TMA and colour the outer part of the chart (below/above TMA)
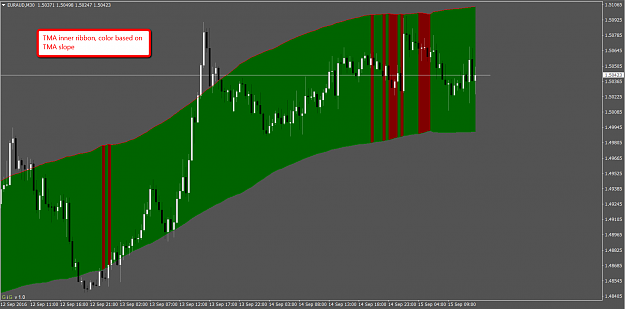
- Display TMA Channel with inner ribbon
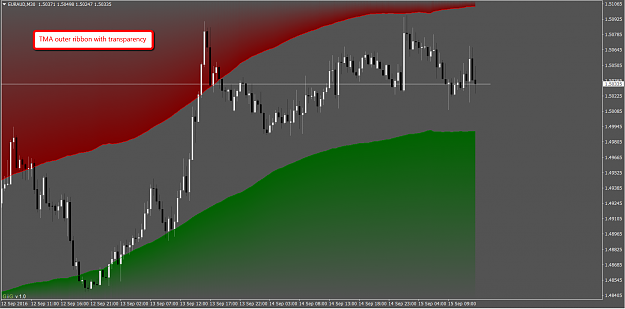
- Display TMA Channel with outer ribbon
In addition, you have:
- some transparency options
- a trend option for the MAs colour (if fast MA above slow MA)
- a channel option to display the MAs
Link:
http://www.greed-is-good.com/forum/v....php?f=61&t=51
Screenshots:
So far, MA ribbons were cluttering your charts, hiding candles and useful informations, they had an awful look on your chart when you were zooming they were looking like that:
Attached Image (click to enlarge)
Now comes this innovative tool which displays the ribbons in a complete different way.
This tool has 9 different modes:
Display 1 MA
- Display 1 MAs and colour the outer part of the chart (below/above MA)
- Display 2 MAs
- Display 2 MAS with inner ribbon
- Display 2 MAS with outer ribbon
- Display Central TMA
- Display Central TMA and colour the outer part of the chart (below/above TMA)
- Display TMA Channel with inner ribbon
- Display TMA Channel with outer ribbon
In addition, you have:
- some transparency options
- a trend option for the MAs colour (if fast MA above slow MA)
- a channel option to display the MAs
Link:
http://www.greed-is-good.com/forum/v....php?f=61&t=51
Screenshots:
Attached Image (click to enlarge)
Attached Image (click to enlarge)
Attached Image (click to enlarge)
Attached Image (click to enlarge)
Attached Image (click to enlarge)
Attached Image (click to enlarge)