Joined Aug 2015
|
Status: Coding Magician
|2,676 Posts
http://i.imgbox.com/eHKn5cDd.png
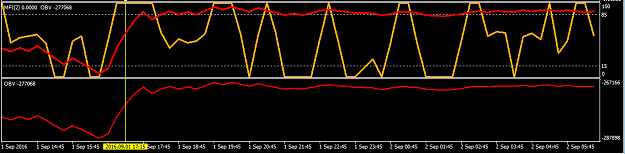
I want to read the values of the red indicator like it were on the top orange moneyflow index chart!
Do not the values in range -250000 to 260000 I want to read them in the range -100 to 100!
How is this possible?
http://i.imgbox.com/eHKn5cDd.png I want to read the values of the red indicator like it were on the top orange moneyflow index chart! Do not the values in range -250000 to 260000 I want to read them in the range -100 to 100! How is this possible? {image}
Ignored
You can place a moving average or Bollinger band on it to act as a trend line. A lower value could act as a change in direction signal, while a really high value could act as a centerline. You won't be able to use them as control limits, but surely a trend line is better than a control limit in most cases.
{quote} You can place a moving average or Bollinger band on it to act as a trend line. A lower value could act as a change in direction signal, while a really high value could act as a centerline. You won't be able to use them as control limits, but surely a trend line is better than a control limit in most cases.
Hey reteid:
I did this before but I used QQE. I was able to get the scale thing figured out for two indicators on one window. We could then use a horizontal line to detect crossings or something like that. I forget it's been a while. I still have the code so I'll take a peak and see if we can use it for this.
Just give me some time, I am on the road and I am using my cell phone so I am all thumbs when I look for things LOL.
Hey reteid: I did this before but I used QQE. I was able to get the scale thing figured out for two indicators on one window. We could then use a horizontal line to detect crossings or something like that. I forget it's been a while. I still have the code so I'll take a peak and see if we can use it for this. Just give me some time, I am on the road and I am using my cell phone so I am all thumbs when I look for things LOL. Peace Jess
Ignored
You can create level lines on many indicators, but I think the reference is for OBV...on balance volume. Since it is tied to transactions, or something like that, it really has no static scale.
Of course can you normalize the values. The money flow index does this also.
Look at the formula of it and you will see the last step is only to normalize it to -100/100. Do the same with the other indicator and you can use both in the same manner