Let's take a look at accuracy with trend line trading to help clear or add to some confusion. The fundamental principle of drawing the trend-line is to first identify the trend i.e. a series of price lower-highs (in the case of a downtrend) or a series of price higher-lows (in the case of an up-trend) and then draw the line so that all the points touching the line are on the same side of the line. A price break or close outside our trend line is usually considered in this way as a cue to take a position in the direction of the break.
But again nothing could be further from the truth.
The line in this case is expected to touch at least 2 of the higher low or lower high points as the case may be and wait for a confirming 3rd or touch 3 points and wait for a confirming 4th. However, generally accepted philosophy among traders is that a 3-point touch validates a trend-line. But if you have ever attempted to dive in with this absolutely correct notion of trend-lines the question ought to have arisen by now with respect to:
- What if there are several valid lower highs and higher lows in the trend. Which one is the best to pick?
- Should all the points that validate the line actually be on the same side of the line?
To answer this question, we prefer to employ some visuals.
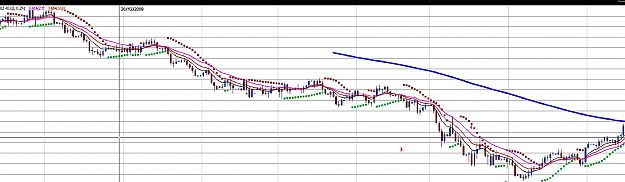
In the chart image (Trend_Pattern (1).png) we identify a market move we wish to analyse.
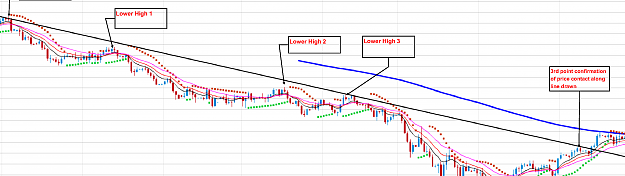
In the chart image (Trend_Pattern (2).png) we then drew a trend line from a high point and picked a second point (lower high 3) and waited for a confirming third point touch which appeared later. In this image we have also identified other potential lower highs to use to validate our trend-line
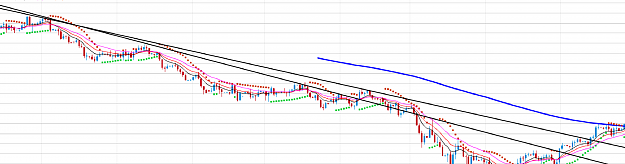
In the chart image (Trend_Pattern (3).png) we drew a second trend line to touch the other points identified in the chart
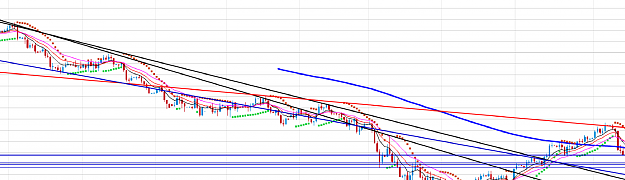
In the chart image (Trend_Pattern (4).png) we added two other valid trend lines with colour coding (blue and red)
In the chart image (Trend_Pattern (5).png) we then attempted to validate all the lines (also with colour coding respectively) with their corresponding point touches on the chart
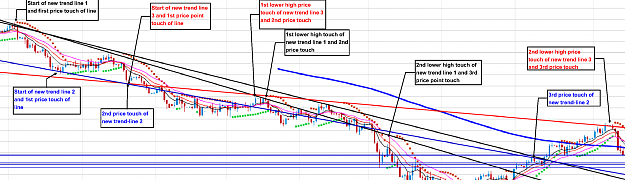
And finally in chart image (Trend_Pattern (6).png) we drew in a lone trend-line in purple and scrolled the chart a bit to the right to reveal what later happened.

Conclusion
Effective and most accurate trend-lines for proper break-out trades are those drawn such that they would have been challenged as both support and resistance in the past. The 3-point touch principle is then used to validate the line.
Goodluck with your trades!
Further Info:
http://etn.mnsei.co.uk