A lot of information has been made available on the subject already on how to use moving averages to confirm the direction of an instruments' trend to guide the trader to make effective and profitable trading decisions. For instance it is well known, among intra-day traders, that to confirm an upward momentum if the 10-day moving average crosses or has already crossed its 20-day counterpart in all the time frames (i.e from the larger to the lower time frames) then the trader has a case to join the trend and vice versa for a downward momentum. I mean nothing could be more laughable and further from the truth.
The primary areas of concern for any trader or rather what should be the traders' primary focus, is encapsulated into three questions. These are namely:
- Is the current market move just beginning
- Is the current market move going to continue
- And lastly is the current market move about to end
When we plant the three questions firmly in our minds and attempt to trade the markets with the traditional method just described, we find ourselves hoping to be right in terms of question number 2 only with no way of measuring questions number 1 and 3 respectively. If you are a trader and find that you are stopped out more times than you actually cash out and you employ traditional moving average techniques as briefly described above to your trading then it explains why you might just be clucthing at straws most of the time.
At this point I'd like to introduce a technique I call "FIMO". FIMO sounds like NIMO and it does remind one of the kids animation movie "finding NIMO". But it would appear that is why it is even more appropriate because believe it or not you are discovering a technique among a huge and enormous sea of ideas (some useful while others are absolute bonkers even though the owners try to make it sound like the "reggae reggae" sauce of the day). FIMO is simply an acronym for "Fibonacci Moving Average" and its simplicity is contained in the application of fibonacci numbers with moving averages. That's all! This method strangely can help the trader to:
- Know when it is time to join a move in progress if the trader had not already taken a position earlier OR
- Know when it is time to get out or cash out and not hold the trade if the trader had taken an earlier position.
The strategy is pivoted around observing the behaviour of the expansion of the moving averges in the current price direction relative to the previous trend. This clearly is a mouthful so we will use some visuals below:
See image of chart showing start of expansion of moving averages in the current price direction (Point of moving average expansion in trend direction.png)
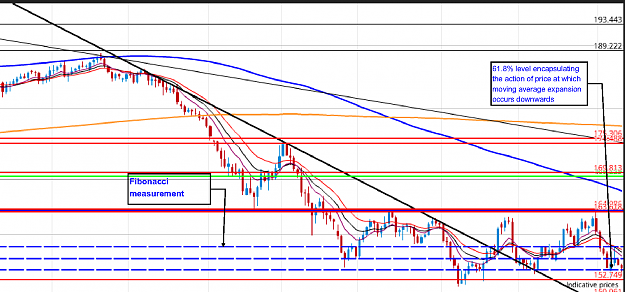
Chart showing fibonacci measurement (Fibonacci measurement.png)
Chart showing the start and end points of the fibonacci measurement range (Fibonacci range.png)
The procedure begins first by:
- Configuring 3 exponential moving averages with 3 numbers on the fibonacci series i.e. 1,2,3,5,8,13,21,...etc (preferrably 8,13,21 and avoid 1,2,3)
Next we then:
- Identify the point at which the moving averages just began to expand in the current price direction. (see point of moving average expansion in trend direction.png)
And lastly:
- We draw a fibonacci retracement measurement (with the 38.2, 50 and 61.8% levels) from the top of the current inflexion point to a low such that the 61.8% line of the fibonacci tool just encapsulates the price action at which the moving average expansion begins to occur (see "Fibonacci range.png" and "Fibonacci measurement.png")
If the expansion of the moving averages is happening or is found to have happened inside the 3 fibonacci measurement levels of 38.2, 50 and 61.8 we have a tradeable momentum at least to the next identified support area or zone first. The same is true for an uptrend or upward momentum as the case may be. So if you are a moving averages trader, when you join a market and you want to know where everyone is and what they have been doing before you join the crowd, you can use this method effectively. Once you have identified a tradeable momentum by this method, you should also note where price is also. If price is close to a significant support or resistance area as the case may be, a break of that support or resistance area is the clue to join the trend in that direction to the next support or resistance zone.
This method works in all time frames as well but for lower time frame traders (aka intra-day traders) it is worth noting where price is first relative to the support or resistance zones in the larger time frame before you make a move in the lower time frames.
Wish you all the best in your trading!!
Further info:
http://etn.mnsei.co.uk