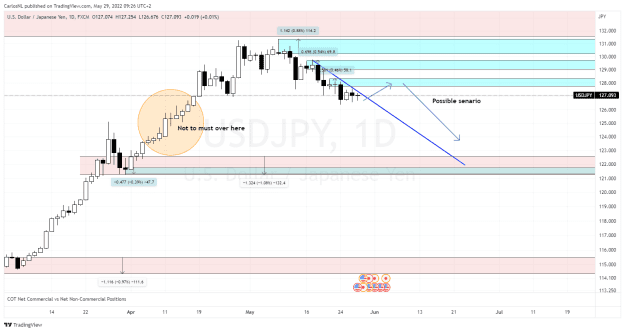
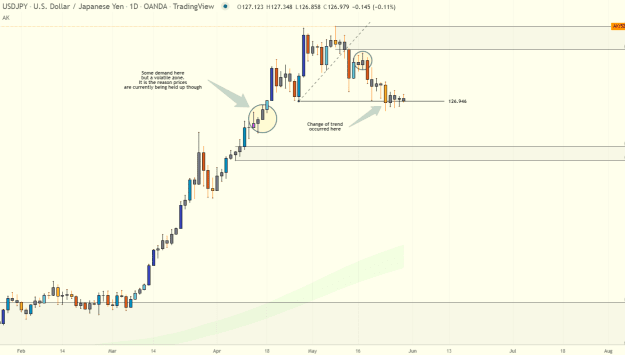
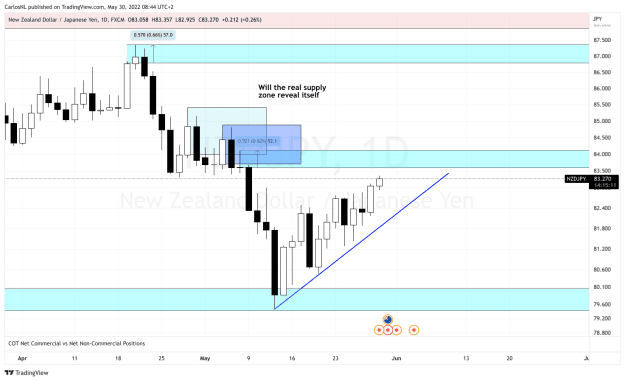
{quote} Hello CarlosNL Some great work here. Thank you for sharing your thoughts if I may, Some thoughts I have on USDJPY on the daily time frame. best wishes{image}
|
Commercial Member
|
Joined Jan 2016
|2,681 Posts
Hello everyone.
An update on an important aspect of the process.
Thanks to Peter for transcribing this from one of my videos from last year.
I have updated the information but for the most part it has not changed much.
Hope it helps
Zone Quality Assessment:
Not all zones are created equal, each needs to be assessed for characteristics that help define the quality.
Characteristics Intrinsic to the zone itself:
A). The strength of the move. Prices can leave a zone in one of three ways:
1) Gap away - more frequently seen in stocks for the sheer reason that those markets close very day and therefore have out of hours "gap risk" where information such as earnings, policy decisions etc are released that may affect the supply-demand dynamics.
2) Large candles, with strong closes - often referred to in the supply and demand community as "ERC" expanded Range Candles.
A couple of important notes about these candles/bars - they are said to be of an expanded range relative to other candles/bars around them, within the same vicinity.
It is also important to note that by “range” we are referring here to the range of the open to close, not the high to low range of the candle. Typically, an expanded range candle is a candle/bar whose range from open to close relative to its high to low range is greater than 50%. However, a trader may wish to apply more stringent criteria to focus on the large moves and define the open to close range relative to high-low range as greater than 75% for example and score such candles/bars higher than others.
By "strong closes", we refer to where price closes strongly within the range of each candle/bar. 60% or higher is preferred for up candles and 40% or less, for down candles.
3) Small indecisive candles/bars OR an alternation of large and small candles - again here, the definition of what is a big candle can be determined by the trader. There is universal consensus that candles/bars with open-close ranges relative to high-low ranges of less than or equal to 50% are "small candles". These types of candles/bars are often fondly referred to in the supply-demand community as 50% candles.
B). The amount of time price stays at a level.
The foundational principle of this characteristic is deeply embedded in the assumption within the methodology that the less time spent at a level, is indicative of the number of orders to buy/sell left within a level. Therefore, time spent at a level is used as a proxy for demand or supply within a level. A general rule of thumb is that the zones where price stayed for only 6 periods or less before departing are better than the zones where price stayed for longer periods.
6 is not a magic number though. If one considers that there are typically 5 trading sessions per week, so on a daily chart one could argue for using 5 as this is also a Fibonacci number for example or 10 periods which would be two trading weeks and a half trading month thereby giving more information. In addition, since the whole idea is to be able to "see" order flow clearly, one could argue that having a minimum number of candles, for example, three or 4 is better for achieving this aim than say for example one or two candles.
Then there is the issue of timeframes. One candle on a monthly chart is roughly the equivalent to 4 candles on a weekly chart which when viewed on a daily chart would be equivalent to 20 candles etc.
To infuse some objectivity and starting from the base premise of less time is better, regardless of timeframe, supply and demand traders apply an assessment system whereby these issues are taken into consideration. They score zones where price stayed 3-6 periods higher than periods where price stayed for one period because 3-6 periods is a better representation of order flow than one period So to conclude, one to two periods is acceptable, 3-5 is preferred, anything greater than 6 periods is not as good when considered on its own without other assessments of zone quality.
C). How far did prices move on departure from a level before returning to the level. This is a measurement used to estimate the initial profit potential that can be reasonably expected from trading a level. The further the better. The distance is objectively measured relative to the size of the zone (measured from entry line aka proximal line to the stop line aka distal line). Distances that measure 3 times the size of the zone for example are considered better than those that measure 2 times the size of the zone. The often-used minimum criteria of a distance moved of at least 2 times is quite popular and is a good starting point.
A final note on this quality assessment item - it is important to remember that it is a crude measure of profit potential, because depending on how quickly prices return to the level, a lot can happen to change the supply-demand equation of that market or timeframe and result in the creation of an opposing level so close to the level the trader is assessing, that the profit potential of a potential trade is reduced, sometimes to the extent that the trade is not worth taking anymore.
It’s therefore advisable that whenever possible, profit potential should be assessed in real time. Some supply and demand traders have also added an addition extrinsic assessment to manage this challenge - when they can, the assess what is referred to as the arrival of price to the zone. As that is not actually an assessment of the zone itself, I will not go into detail about that here, suffice to say that it requires the trader to be present in front of his/her charts to do the assessment, which may not always be possible depending on the trader's life or trading style.
D) Did the departure from the zone result in the removal of opposing orders (above and to the left in the case of a demand zone, or below and to the left in the case of a supply zone) or new price discovery in terms of new highs or new lows being reached because of the departure of price from a zone.
This is a very important assessment for supply and demand traders to make because of the message such price movements convey to other market participants. Working from the premise of zones being representative of orders to buy/sell in the market therefore representing buyers and sellers, the removal of one group by another indicates two things, strength, and better profit potential. Supply and demand traders therefore often give this point the highest rating in the assessment, either as a stand-alone assessment or in combination with how far prices moved from the level (point c above)
Having this criterion fulfilled is part of a larger assessment of zone quality and is better used that way, rather than as a standalone measurement on its own.
E). How deep price has penetrated a zone following or during its creation -often referred to as the freshness by practitioners. This assessment is done to gauge the number of buy/sell orders within a zone. Whilst this is entirely unknowable, having a framework such as this helps the trader attempt to quantify order flow size. It is also a crude measure as is the measure of how far price moved away from a level as described above. The fresher the better.
A virgin "untouched" zone is usually better than a zone that has been "tested" many times. Note - there is a particular type of test of a zone that can be helpful for the trader in assessing the number of orders potentially left at a zone. It is the first test of a zone that only reaches the proximal line with little or no penetration of the zone.
Here is a model that can be used for assessing Degrees of penetration. It is not the only model, but I think it is a good starting point:
1. Totally fresh
2. Price has returned to the level on one occasion with <= 25% penetration
3.. Price has returned one or more times with a >25% return on at least one of the returns but no penetration was greater than 50% of the width of the zone.
4. Price has returned one or more times to the level with at least one penetration being >50%.
It is worth noting that this is just a representative system and traders will make their own adjustment, for example only using points 1 and 2, ignoring the others. The trader may also decide what type of penetration he/she trades. He/she may decide that they will only trade totally fresh zones for example.
Final Thoughts: The above assessment of the intrinsic quality of a zone is an important part of supply and demand trading. It provides the much-needed framework for choosing between zones on a chart, of which there are many. It does not however determine whether a trade will work or not.
A poor scoring zone will work sometimes, while sometimes a high scoring one will entirely fail. This is the market uncertainty that no methodology will ever be able to take away because it is just what it is, part of the market's own psychology.
These assessments should be done at the very least, on zones the trader is considering trading on the entry timeframe he/she chooses. Doing these assessments on multiple timeframes is an added level of complexity which is often rewarding even if not usually necessary. My preference is to do it on every zone of interest on every timeframe. Other traders may choose to do it just on the entry timeframe, which is also fine.
Finally, there are a few other assessments that the trader must make - of trend and price location relative to higher timeframe levels, correlation etc. These are extrinsic considerations to the entry zone but nonetheless, very important to consider...
Best wishes.
Be careful what you think because your thoughts run your life..Solomon
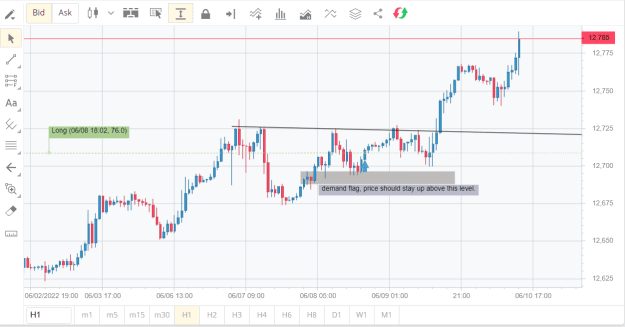
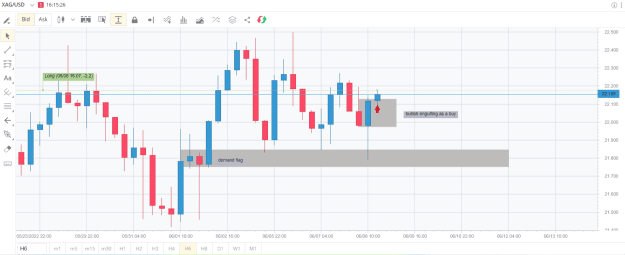
6 hour chart has hit a demand flag and we've created a bullish engulfing candle along the way up. initial supply is at 22.222 & 22.370. which is the highs on the 6h chart but on lower time frame. If you look into it you can see it.
Attached Image (click to enlarge)
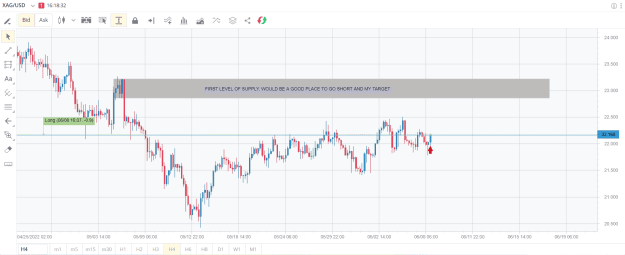
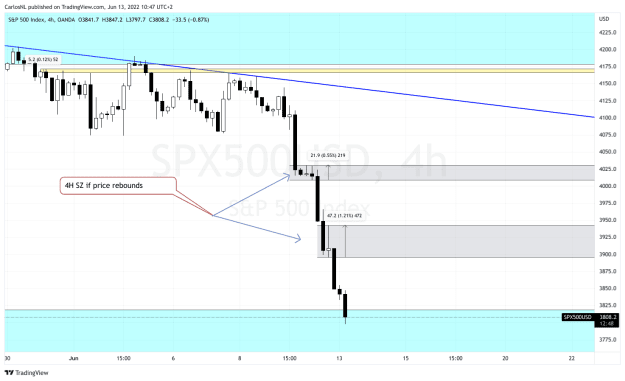
My target would be this supply on 4h chart. I will also place some shorts at this level.
XAG/USD CHART: 6 hour chart has hit a demand flag and we've created a bullish engulfing candle along the way up. initial supply is at 22.222 & 22.370. which is the highs on the 6h chart but on lower time frame. If you look into it you can see it. {image} My target would be this supply on 4h chart. I will also place some shorts at this level. {image}
Ignored
got stopped out.
USD setup was a little more successful. this setup was similar to the silver chart