Hi everyone,
I'd like to share my new trading system that I have developed over a number of months. It is based on the deviation of price versus its moving average, otherwise known as the "disparity index" by the Japanese. The theory behind it is that price will always find equilibrium, but equilibrium is vague. The equilibrium I am referring to is the moving average of price itself. Why do we get retracements on trending markets? It is because the market is returning to its 'equilibrium' either to continue in the original direction or break out of the trend. This is what this system is all about. It is to identify areas where price is trending and retracing to its moving average, or the equilibrium point, and finding opportunity to enter and make some money. In ranging markets, you won't find any setups, which is great because that's not what we want anyway. We want trending markets and entry opportunities in such movements. It is a very reliable system on higher timeframes as I will show you. Risk reward is great and being on a higher tf shields you from crazy price movements that we typically see with news announcements. Anyhow, enough talk and let's see where this leads us.
Entry Criteria:
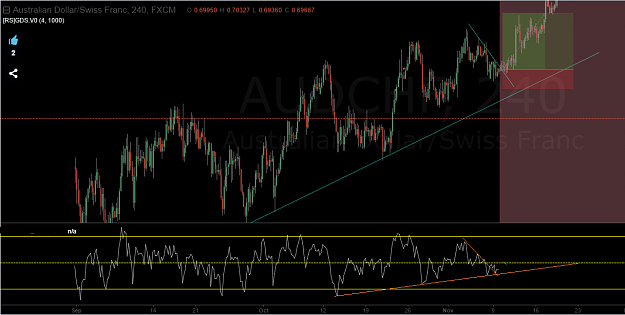
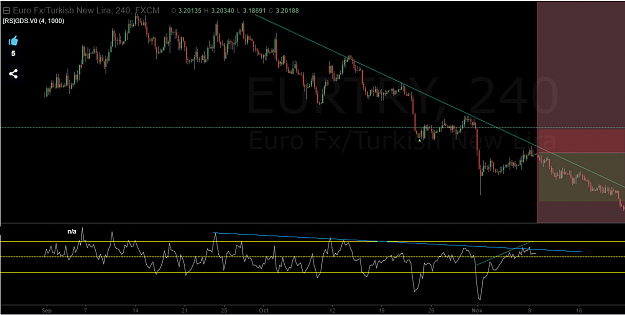
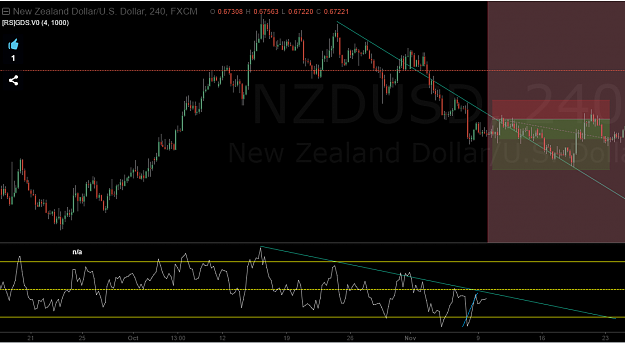
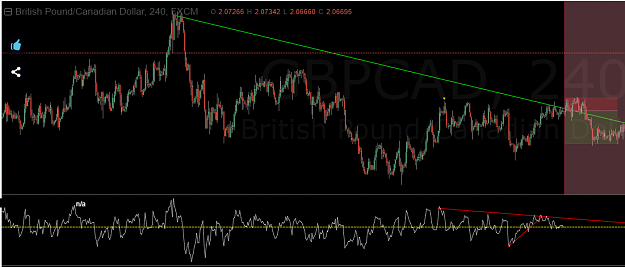
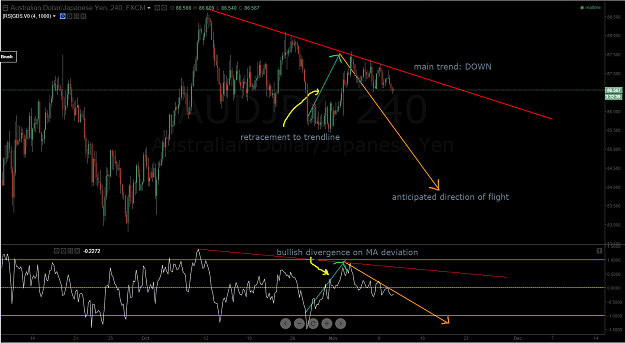
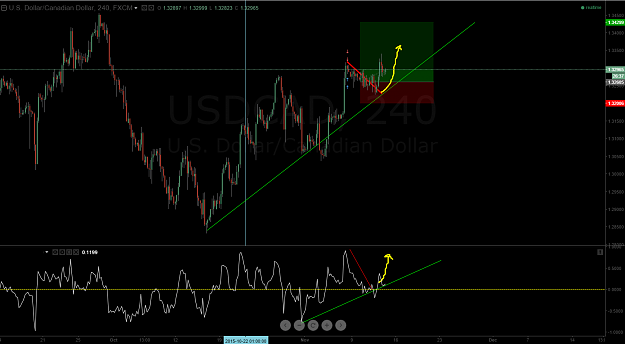
On the DAILY or H4 timeframes (either or, its up to you): 1) Identify a trend in existence. This is simply scanning an instrument and look at the chart. If you see a visible trend (up or down), draw a trend line connecting all the highs/lows and then we move on to the second entry condition:2) Put on the disparity index on your chart and identify any divergence happening. If there is no divergence then skip on to the next pair. I've attached the indicator here for you. MA period 13. The goal is to look for divergence on the disparity index and relate it to the PA trend line. What we want is price to retrace to its trend line, and at the same time seek a retracement of the disparity index to its own divergence trend line. Whichever comes first (the retracement on the PA or on the disparity) is the trade you need to take. Pictures are worth a thousand words so lets look at a few. I've attached a few examples below.
Your exit, take profit, stop loss, and other order attributes is all up to your money management criteria. All I can provide is a system that can provide entries that are higher probability winners than if you were to randomly enter into a trade. If a trade goes against you, how you handle a losing trade is what will differentiate you as a successful trader or not.
I'd like to share my new trading system that I have developed over a number of months. It is based on the deviation of price versus its moving average, otherwise known as the "disparity index" by the Japanese. The theory behind it is that price will always find equilibrium, but equilibrium is vague. The equilibrium I am referring to is the moving average of price itself. Why do we get retracements on trending markets? It is because the market is returning to its 'equilibrium' either to continue in the original direction or break out of the trend. This is what this system is all about. It is to identify areas where price is trending and retracing to its moving average, or the equilibrium point, and finding opportunity to enter and make some money. In ranging markets, you won't find any setups, which is great because that's not what we want anyway. We want trending markets and entry opportunities in such movements. It is a very reliable system on higher timeframes as I will show you. Risk reward is great and being on a higher tf shields you from crazy price movements that we typically see with news announcements. Anyhow, enough talk and let's see where this leads us.
Entry Criteria:
On the DAILY or H4 timeframes (either or, its up to you): 1) Identify a trend in existence. This is simply scanning an instrument and look at the chart. If you see a visible trend (up or down), draw a trend line connecting all the highs/lows and then we move on to the second entry condition:2) Put on the disparity index on your chart and identify any divergence happening. If there is no divergence then skip on to the next pair. I've attached the indicator here for you. MA period 13. The goal is to look for divergence on the disparity index and relate it to the PA trend line. What we want is price to retrace to its trend line, and at the same time seek a retracement of the disparity index to its own divergence trend line. Whichever comes first (the retracement on the PA or on the disparity) is the trade you need to take. Pictures are worth a thousand words so lets look at a few. I've attached a few examples below.
Your exit, take profit, stop loss, and other order attributes is all up to your money management criteria. All I can provide is a system that can provide entries that are higher probability winners than if you were to randomly enter into a trade. If a trade goes against you, how you handle a losing trade is what will differentiate you as a successful trader or not.
Attached Image(s) (click to enlarge)
Attached File(s)
Take this course: https://shorturl.at/upBey