Ah fibonacci retracements, there isn't a day that goes by where I don't here some analysis claiming xxx/xxx is heading north due to a fibonacci retracement here and a fibonacci retracement there, and like most I followed the masses, trod the same well worn path and threw fibonaccis around on my chart like they were going out of style.
Only thing is, to me there are much more logical explanations as to why price is turning then the mathematical phenomenon that is fibonacci in nature applied to price. I could go into a thousand words on the topic, but I'll let pictures say those words for me.
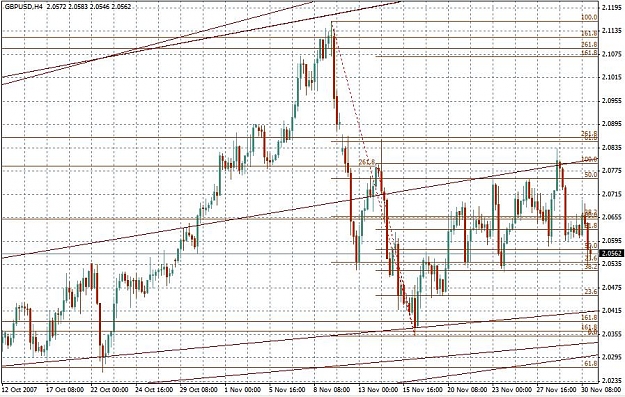
Let's look at the current pound charts for the most recent 4H upward trend (always shows the best retracements). I'm sure there are many places around the web claiming the beauty of fibonacci retracements with a chart similiar to this:
.. I have a question though, firstly, why, when dealing with retracements we seem to ignore the overshoots, that first black retracement didn't retrace 38.2% at all .. it retraced somewhere around 41.9% ... where is the golden ratio in that number? ... it is the same of all subsequent retracements ... if we are going to claim proportions according to the golden ratio, we can't claim 41.9%, 69.7%, 52.1% etc. are moving to the beat of fibonacci. Am I being picky ... yep most definitely
To me pure logic seems to make more sense to me ... taking the same chart, lets look at each retracement seperately and see if there is another reason other than fibs to explain why price turned:
Only thing is, to me there are much more logical explanations as to why price is turning then the mathematical phenomenon that is fibonacci in nature applied to price. I could go into a thousand words on the topic, but I'll let pictures say those words for me.
Let's look at the current pound charts for the most recent 4H upward trend (always shows the best retracements). I'm sure there are many places around the web claiming the beauty of fibonacci retracements with a chart similiar to this:
http://img512.imageshack.us/img512/5323/gbpusd1kt4.gif
.. I have a question though, firstly, why, when dealing with retracements we seem to ignore the overshoots, that first black retracement didn't retrace 38.2% at all .. it retraced somewhere around 41.9% ... where is the golden ratio in that number? ... it is the same of all subsequent retracements ... if we are going to claim proportions according to the golden ratio, we can't claim 41.9%, 69.7%, 52.1% etc. are moving to the beat of fibonacci. Am I being picky ... yep most definitely
To me pure logic seems to make more sense to me ... taking the same chart, lets look at each retracement seperately and see if there is another reason other than fibs to explain why price turned:
http://img84.imageshack.us/img84/562...collagelv0.gif
So did price move because a sunflower is in perfect proportions to the golden ratio, or the egyptians (oh how I could go back to that time) built their pyramids to it ... or because of simple supply and demand? Position protection and liquidation? .. and how do we explain all the other ratios that price shot straight through, what happened to the magic of fibs then? ... to me there is always a more logical explanation.
You can quit and they won't care, but you will always know.