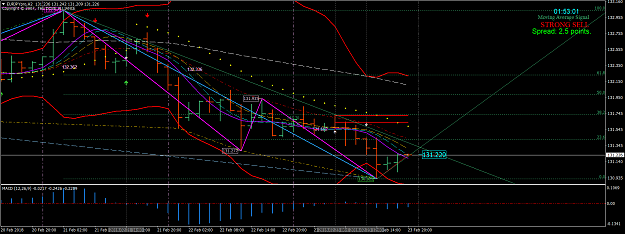
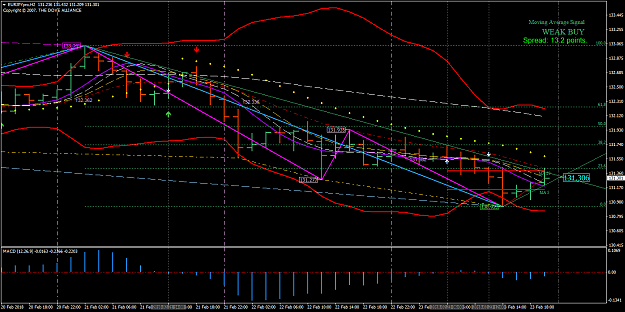
Disliked{quote} Adjustments: H2 fibo flipped and touched lower BB. H4 current candle crossed 100.0 fibo. Daily touched 0.0 fibo. Target H2 EMA. I will go long here. Final Entry: Long at 131.670 for 40/40. {image}Ignored
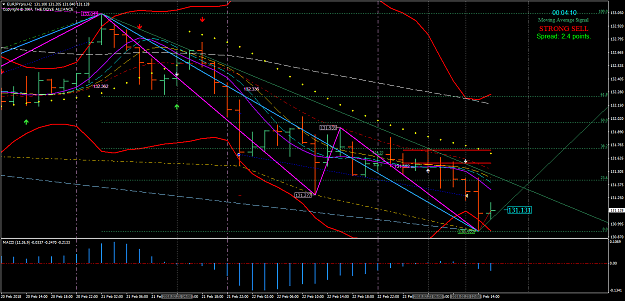
Self Evaluation: I think this entry was good. But I was 1 minute too late for the entry. I entered 4 minutes before open candle. If I could enter 5 minutes before I could get a much lower price. As I have seen, long candles start retracing 5 minutes ago on support / resistance. TP didn't hit for 2.7 pips. My target was H2 EMA. It did went for EMA but didn't hit for 3 pips. Market hit EMA with SAR after some candle but EMA was lower then before. Also market movement was very tight. Anyway... a loss is a failure. Will see if I can improve in future.
Have a good weekend everybody...
Attached Image (click to enlarge)
1