Guys, long story short: I found a few sites out there that will tell you the support/resistance levels for various pairs. We all know that these are wide range areas and not lines, but... their (and my) results are very different sometimes. And this makes me question my own judgement ( I guess confidence is what I need most).
My questions are:
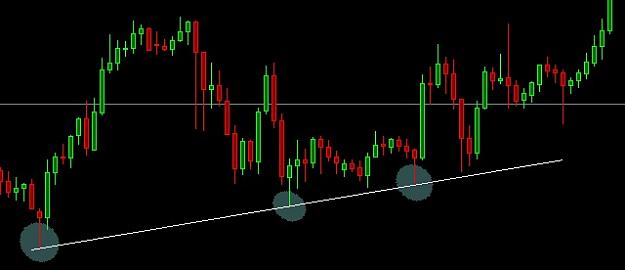
1. Do you think it is better to ignore these online advice and draw my own S/R? How do you do it?
2. If you're using some online site to advise about S/R lines, which one is it? (leave a link, please, I'd like to compare with my charts)
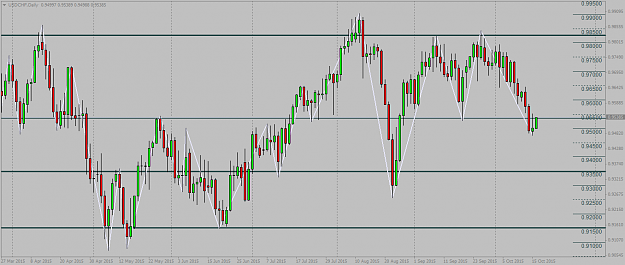
3. 3rd option = I suck and they're all right. What do you think of my S/R for UsdChf? Are they ok? (tell me if I'm wrong; I chose a random chart with 4 important levels... or at least this is what I see. I usually try to get closes to the round numbers, if they're close enough)
Cheers.
My questions are:
1. Do you think it is better to ignore these online advice and draw my own S/R? How do you do it?
2. If you're using some online site to advise about S/R lines, which one is it? (leave a link, please, I'd like to compare with my charts)
3. 3rd option = I suck and they're all right. What do you think of my S/R for UsdChf? Are they ok? (tell me if I'm wrong; I chose a random chart with 4 important levels... or at least this is what I see. I usually try to get closes to the round numbers, if they're close enough)
Attached Image (click to enlarge)
Cheers.
Using the RobotFX EAs for a while https://www.robotfx.org/