• Home
  • Forums
  • Trades
  • News
  • Calendar
  • Market
  • Brokers
  • Login
  • Join
  • User/Email: Password:
  • 5:01am
Menu
  • Forums
  • Trades
  • News
  • Calendar
  • Market
  • Brokers
  • Login
  • Join
  • 5:01am
Sister Sites
  • Metals Mine
  • Energy EXCH
  • Crypto Craft

Options

Bookmark Thread

First Page First Unread Last Page Last Post

Print Thread

Similar Threads

Bollinger Band for 5mins trading 14 replies

Bollinger band trading 61 replies

Trading with Bollinger Band and Moving Average indicator 41 replies

Bollinger Band Day Trading System 8 replies

ema bollinger band alerts 1 reply

  • Trading Systems
  • /
  • Reply to Thread
  • Subscribe
  • 7
Attachments: Bollinger Band Confluence Trading
Exit Attachments
Tags: Bollinger Band Confluence Trading
Cancel

Bollinger Band Confluence Trading

  • Post #1
  • Quote
  • First Post: Nov 6, 2007 10:12am Nov 6, 2007 10:12am
  •  Kramer
  • | Joined Oct 2007 | Status: Member | 11 Posts
I would like to share with you a method of trading that I have been using with success for over a year.

It’s not a mechanical ‘set and forget’ system - there is an element of discretion involved, both with the decision to enter a trade, and setting stop losses and profit targets. And it’s no ‘Holy Grail’, as with life in general, you will only get out of it what you put in.

When I started out trading, I experimented with pretty much every indicator out there, looking for the perfect mechanical system. And I am pretty much convinced that there isn’t one. In my experience, the vast majority of purely mechanical systems are too reliant on a particular set of variables/market conditions, and when there is a deviation from those conditions, the vast majority of them fail.

It is far better to arm yourself with a few simple tools, and learn how to use those tools under any market conditions. Using this approach I have developed a method which gives high probability set ups, is consistently profitable and is not dependent on any particular market environment. I trade this method successfully in both ranging and trending markets.

My method trades off a 1H chart in conjunction with a 4H chart and uses the following tools:


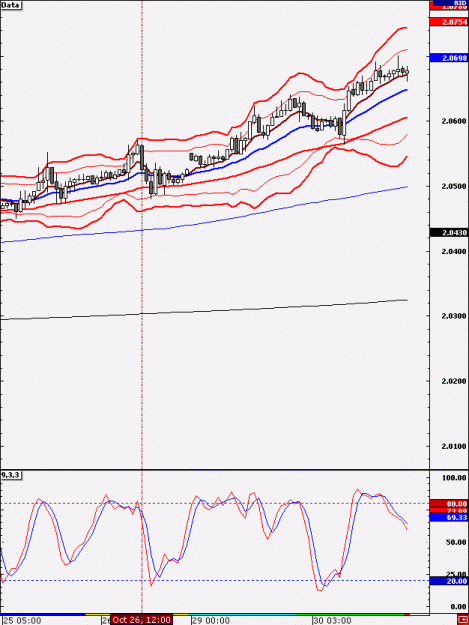
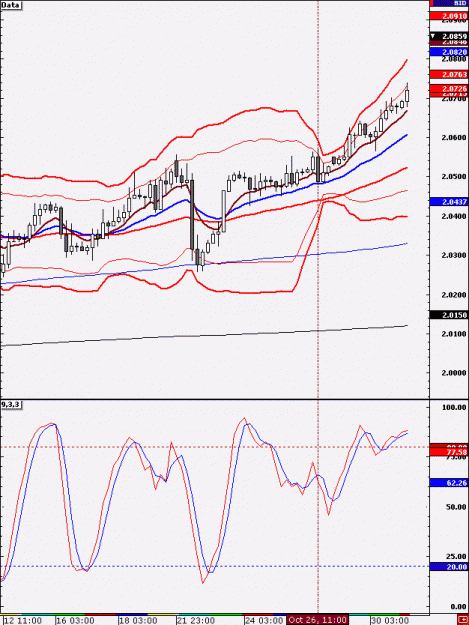
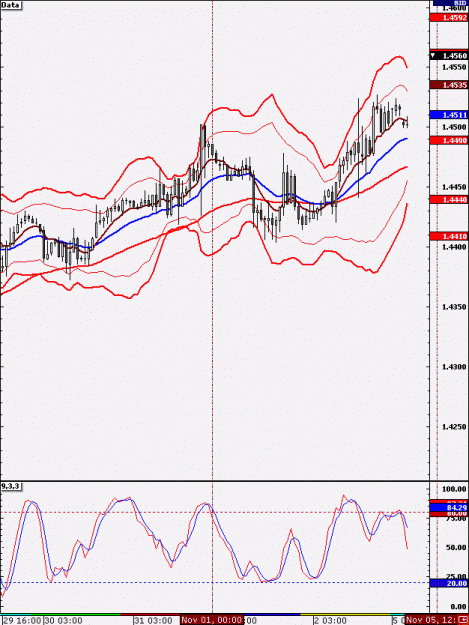
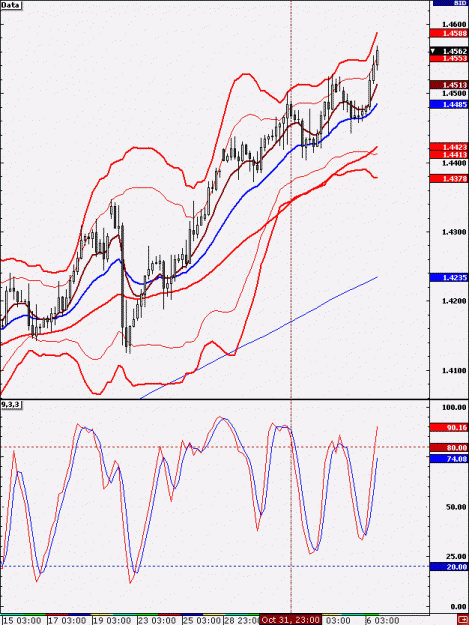
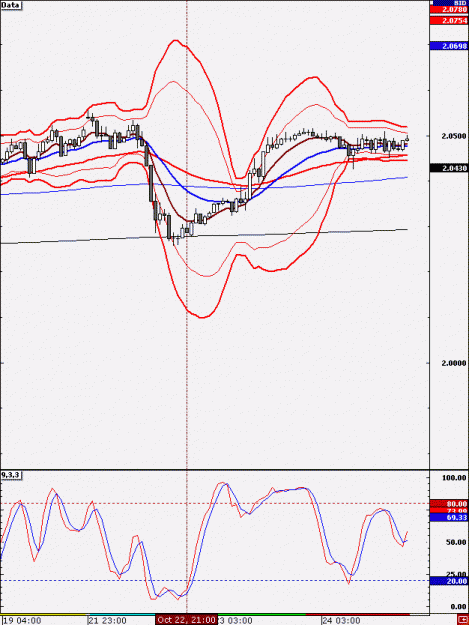
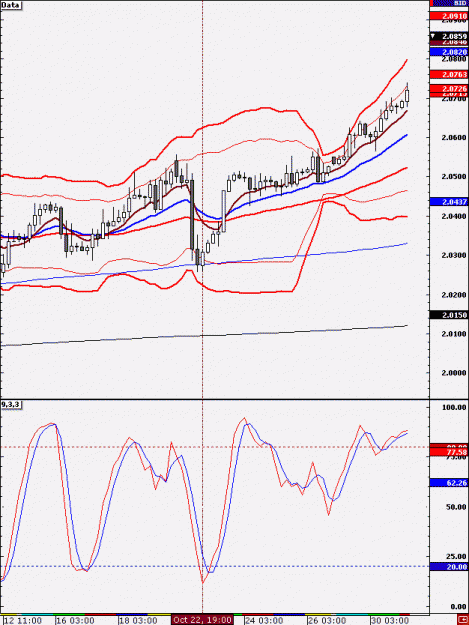
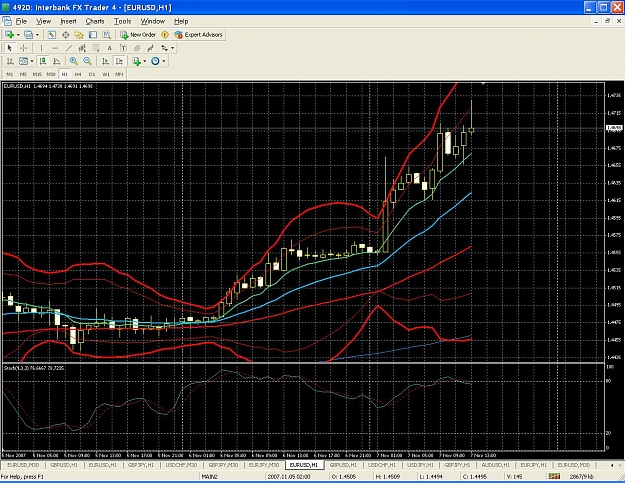
  1. Bollinger Bands. I use 2 sets of Bollinger Bands, set at 2 standard deviations and 3 standard deviations over 20 periods. As we will see, these bands provide the backbone of my method, and are my starting point in my trade analysis.

  1. Stochastics. There are so many oscillating indicators out there, and I’ve tested most of them over the years, but I always come back to the good old fashioned stochs. The settings I use are 9,3,3.

  1. Moving averages. These give me a feel for direction and trend, whether there is a strong trend in place, if trend is changing, or whether the market is ranging. Equally importantly, they also provide dynamic levels of support and resistance, and are very useful to determine profit targets and stop loss levels. I use 8 EMA and 21 EMA to track short term direction and a 55EMA to track medium term trend. All good old fashioned fib numbers. These are all exponential MA’s – I think it’s more important to get a feel of more recent price action (and more importantly they tested better during my backtesting). I also have on my charts a 200 and 800 SMA for longer term trend.

  1. Confluence. Hey, where do I find the ‘Confluence indicator’ on my charting platform? Ha ha, remember what I said about this not being a ‘set and forget’ system? Confluence is where different MAs, support and resistance, Bollinger Bands, fib lines, or other technical indicators occur at identical price levels. Confluence is a powerful tool, as identifying these levels enables us to enter (or exit) trades with a much greater degree of confidence. Identifying these areas of confluence is key to high probability trading, and is a key element in my trading strategy.

At present I am only trading this method on GBP/USD, EUR/USD and USD/JPY, and taking my trades off a 1H chart (in conjunction with a 4H chart). There is no reason in theory why this strategy will not work with any other currency pair ( or indeed other time frames). It’s just that these are the pairs I have tested this method with, and the pairs whose price movement I am very familiar with.

In my next post, I’ll illustrate how I take my trades.

  • Post #2
  • Quote
  • Nov 6, 2007 10:17am Nov 6, 2007 10:17am
  •  Kramer
  • | Joined Oct 2007 | Status: Member | 11 Posts
As I mentioned above, I trade this method using both a 1H and 4H chart. The first thing I look for is price breaking through the outer Bollinger Band (set at 3 standard deviations) on the 1H chart. We’ll call this level BB3. The next thing I need to see is that price has broken the inner Bollinger Band level on 4H (which we will call BB2). This tells us that at some point in the near future, we can expect a pullback or a ‘reversion to the mean’ (which is ultimately what Bollinger Bands calculate).

Right, so far so good. The thing is, if price is in a strong up or down trend, we can’t just take a trade on the basis that a candle closed outside BB3. OK, yes, we can say that, from a statistical viewpoint, only 1% of candles will close outside BB3, but there is a significant risk if momentum is strong that price will continue in the same direction.

That’s where our stochastics come in. Chances are, once we get into BB3 territory on 1H, we are more than likely in oversold or overbought stoch territory (ie less than 20 or greater than 80). However, what we need to see before considering a trade is %K crossing %D from below 20 (for a long trade) or from above 80 (from a short trade).

As an aside, and to avoid confusion, I don’t worry too much what the direction of the stoch on 4H is doing. Ultimately we’re taking a trade off a 1H chart, and given the lagging nature of stochastics, waiting for the stochastic to turn on 4H is not practical.

A quick word of warning. The order of the signals is important. On the one hour chart, price needs touch BB3 first. That provides us with notice, an ‘early warning system’ that we should be on the look out for a reversal in the next few candles. We then wait for the stochs to cross above 20/below 80.

Once we’ve got this signal, we’re pretty much there. Before pulling the trigger, however we need to look at where our moving averages are, as they provide key dynamic levels of support and resistance, as to whether a trade can be justified on a risk:reward basis. This will depend a lot on the nature of the move, and how quick it was, and whether we are in a ranging or a trending market.

Stops and Profit Targets. OK, I guess this is the hard part, because there’s no right or wrong answer. I usually look for a risk:reward ratio (‘RRR’) of 1:1.2 or better. Because this system has such a high hit rate, even a RRR of 1 would be acceptable, but I’m a very conservative trader, and along with looking for high probability trades, I also look for a good RRR. There are myriad ways of setting stop losses and profit targets, and much will depend on the nature, style and risk tolerance of each trader, so I won’t go into too much detail here. Ultimately, it’s up to you. A good target is the other side of the Bollinger Band level 2 (BB2), but just bear in mind where your other levels of potential support and resistance might be, both on 1H and 4H. As we progress, I’ll post some charts to illustrate how I analyse potential trade set ups.

Basically, that’s it. There are a few other little tricks I use, which I’ll get onto later, but the above methodology forms the foundation of my trading. Once you get used to analysing 2 time frames simultaneously, and get a feel for the price action of the currency pair you are following, it’s a relatively simple system to implement.

I would recommend not to try to track too many pairs – there’s a lot to look at and take in, and it’s all too easy to lose focus and perspective if you are constantly looking at 8 pairs or more. I would suggest starting with perhaps 2 or 3 pairs. Start off with a demo account, do your backtesting, and when you feel comfortable enough to pull the trigger, start trading live.

Please feel free to let me have any comments or questions. As I’ve mentioned previously, I am trading live with this method with a lot of success, although I am more than open to comments/suggestions to improve it further!!!

In the next couple of posts, I will post some screenshots of some example trades.

Thanks,
Kramer
 
 
  • Post #3
  • Quote
  • Nov 6, 2007 10:24am Nov 6, 2007 10:24am
  •  Kramer
  • | Joined Oct 2007 | Status: Member | 11 Posts
My chart settings are as follows:

8EMA (thick green line)
21EMA (thick blue line)
55EMA (thick red line)
200SMA (thin blue line)
800SMA (thin black line)
Bollinger Bands (2 standard deviations, 20 periods) - thin red line
Bollinger Bands (3 standard deviations, 20 periods) - thick red line
Stochastics - 9,3,3

On October 26, price breaks through BB2 on 4H and BB3 on 1H (on the 11am candle). The stochs cross down below 80 on the 12pm candle, and that’s our entry signal. We can see from the 4H chart that price has been trending upwards the previous couple of days, so we must still be weary of taking a trade against the trend. So our initial target can be placed at the 21EMA on 1H, which is around the same level as the 8EMA on the 4H. In the end price came down to touch the 21EMA on 4H for a potential 80 pips.
Attached Image(s) (click to enlarge)
Click to Enlarge

Name: 1H_GBPUSD_26_Oct.gif
Size: 17 KB
Click to Enlarge

Name: 4H_GBPUSD_26_Oct.gif
Size: 20 KB
 
 
  • Post #4
  • Quote
  • Nov 6, 2007 10:35am Nov 6, 2007 10:35am
  •  Kramer
  • | Joined Oct 2007 | Status: Member | 11 Posts
Here was another textbook trade. Price had moved up very strongly throughout the day, and had broken through BB3 on both 1H and 4H. As a general rule, when price touches the 3 standard deviation BB on the 4 hour chart, we can usually expect a significant pullback. For added confirmation, the stochastics had also crossed above 80 and were heading down on the 4H chart, which is another sign of a significant pullback to come.


In terms of profit targets, because we have the BB3 levels being hit and stochastics crossing on both 1H and 4H, we can be a bit more bullish, and target the 21EMA on the 4H (which is at roughly the same level as the other side of BB2 on 1H). This would have given us a target of around 60 pips. Placing the stop 5 pips above the high of the day (25 pips or so) gives us a risk:reward ratio of over two, which makes it a sensible trade to take.

If we had wanted to stagger our profit targets, we could have taken part out at the 8EMA and part out at the 21EMA on 4H.
Attached Image(s) (click to enlarge)
Click to Enlarge

Name: 1H_EURUSD_31_Oct.gif
Size: 21 KB
Click to Enlarge

Name: 4H_EURUSD_31_Oct.gif
Size: 23 KB
 
 
  • Post #5
  • Quote
  • Nov 6, 2007 10:56am Nov 6, 2007 10:56am
  •  masilva
  • | Joined Mar 2007 | Status: Member | 66 Posts
Hi Kramer,

System looks good, thanks for sharing.

Question, Do you wait for 1H bar to close to confirm stochs crossing ?

regards
 
 
  • Post #6
  • Quote
  • Nov 6, 2007 11:02am Nov 6, 2007 11:02am
  •  Kramer
  • | Joined Oct 2007 | Status: Member | 11 Posts
This is an example of a trade set up I’m always on the look out for. Price breaks through BB3 on 1H, BB2 on 4H, and finds support on the 200SMA on the 4H (which is also the 800SMA on the 1H chart). It hovers around there for a couple of hours, during which time our stochs on 1H cross and turn up above 20, giving us our entry signal.

The next stage is to calculate our likely profit targets and stop loss levels. Even if we just target the 8EMA on the 4H chart, that’s over 90 pips away (and it often moves further when the stochastics are oversold on the 4H chart). In terms of a stop loss, we have the benefit if the 200/800SMA providing solid support, so if that is broken by more than 10/15 pips or so, then we would definitely want to exit the trade. So with a target of 90, and SL of 30, it’s also a valid trade from a risk:reward perspective.
Attached Image(s) (click to enlarge)
Click to Enlarge

Name: 1H_GBPUSD_22_Oct.gif
Size: 18 KB
Click to Enlarge

Name: 4H_GBPUSD_22_Oct.gif
Size: 20 KB
 
 
  • Post #7
  • Quote
  • Nov 6, 2007 11:21am Nov 6, 2007 11:21am
  •  SynWind
  • | Joined Jan 2007 | Status: pip by pip | 73 Posts
this system looks very good. but it look like it trading on counter trend??
 
 
  • Post #8
  • Quote
  • Nov 6, 2007 1:24pm Nov 6, 2007 1:24pm
  •  Kramer
  • | Joined Oct 2007 | Status: Member | 11 Posts
Quoting masilva
Disliked
Hi Kramer,

System looks good, thanks for sharing.

Question, Do you wait for 1H bar to close to confirm stochs crossing ?

regards
Ignored

Hi masdilva. yes, usually i do. i'm a conservative trader by nature, and this gives extra confirmation that we can expect a retracement. also, ideally, i like to see the K% line below 80.

Cheers
Kramer
 
 
  • Post #9
  • Quote
  • Nov 7, 2007 2:04am Nov 7, 2007 2:04am
  •  Kramer
  • | Joined Oct 2007 | Status: Member | 11 Posts
Quoting SynWind
Disliked
this system looks very good. but it look like it trading on counter trend??
Ignored
Hi SynWind. Yes, you’re absolutely right, sometimes trades are taken against the trend on the 4 hour chart. That said, however, the cross of the stochs and price easing off BB3 on 1H gives us a heads up that a retracement is in play. And moreover, these trades are only taken if the risk:reward ratios justify taking the trade. Sometimes they won’t, and I’ll pass on the trade.

Kramer
 
 
  • Post #10
  • Quote
  • Nov 7, 2007 2:16am Nov 7, 2007 2:16am
  •  billbss
  • Joined Apr 2006 | Status: Member | 4,301 Posts
Hi, Kramer,

Interesting method.

Do the stochastics need to fall below 80 or above 20 to take a trade?
On your charts you show K-D crosses, but not necessarily a drop below/above 80 or 20.

Thanks
 
 
  • Post #11
  • Quote
  • Nov 7, 2007 4:12am Nov 7, 2007 4:12am
  •  Kramer
  • | Joined Oct 2007 | Status: Member | 11 Posts
Quoting billbss
Disliked
Hi, Kramer,

Interesting method.

Do the stochastics need to fall below 80 or above 20 to take a trade?
On your charts you show K-D crosses, but not necessarily a drop below/above 80 or 20.

Thanks
Ignored


Bill, that’s a good question. Normally, I do prefer stochs crossing and the K% line dropping below 80/above 20. There are exceptions, though. For example if the stochs have gone way past 80, and are in the 90’s. If the stochs then turn, and we get a cross at, say 82, I’m not going to split hairs and wait till we get the drop below 80. The main thing I like to see is a clean cross and some continued movement in our direction after the cross.

Hope this helps.
Kramer
 
 
  • Post #12
  • Quote
  • Nov 7, 2007 6:46am Nov 7, 2007 6:46am
  •  SynWind
  • | Joined Jan 2007 | Status: pip by pip | 73 Posts
why don't trade along with the trend? i thought it was safer??
 
 
  • Post #13
  • Quote
  • Nov 7, 2007 8:41am Nov 7, 2007 8:41am
  •  billbss
  • Joined Apr 2006 | Status: Member | 4,301 Posts
Hi Kramer,

I hope this screenshot is clear enough for you to answer my question:

Is the sell signal on the last bar acceptable?

The reason I question it is that the penetration of BB3 occurred 10 or 12 hours ago and hasn't happened since.

The overbought stochastic isn't really in response to the BB3 being breached.

I hope I asked this in a way that makes sense.
Attached Image (click to enlarge)
Click to Enlarge

Name: EUBB.JPG
Size: 272 KB
 
 
  • Post #14
  • Quote
  • Nov 7, 2007 10:54am Nov 7, 2007 10:54am
  •  Kramer
  • | Joined Oct 2007 | Status: Member | 11 Posts
Quoting billbss
Disliked
Hi Kramer,

I hope this screenshot is clear enough for you to answer my question:

Is the sell signal on the last bar acceptable?

The reason I question it is that the penetration of BB3 occurred 10 or 12 hours ago and hasn't happened since.

The overbought stochastic isn't really in response to the BB3 being breached.

I hope I asked this in a way that makes sense.
Ignored

Hi Bill. You’re spot on, ideally you want to see a break of BB3, then a pullback, and the stochs turning as a result of that pullback. This gives us the filter we need, to confirm that the pullback is just a ‘breather’ before pushing on up, as EUR/USD did today. I don’t have a set number of bars for the stochs to turn, it’s just a matter of feel. But if you look at the bar 4 bars before that last one, this was only a few pips short of the BB3 level, and this was the bar which pushed the stochs into overbought territory.

I didn’t take this trade because it was too high risk due to the big uptrend in EUR/USD at the moment, and to go against such a trend was potential suicide.

Incidentally, when I was developing this method, and playing around with different moving averages and standard deviations, I tried a method which calculated the distance between price and the 8 EMA after big breakouts, to try and calculate the probabilities of a pullback at different . A little while ago the difference was over 70 pips on the 4 hour chart, and the last time price pulled away that much was during the shenanigans during August…..

My trade plan going forward: price seems now appears to be coming off its highs, and stochs have also now crossed on 4H. If I see a candle close below the 8EMA on 1H (indicating a break of the short term trend), I will take a short. My target will be the 21EMA on 1H (currently 1.4635).

Hope this helps,

Kramer
 
 
  • Post #15
  • Quote
  • Nov 7, 2007 12:36pm Nov 7, 2007 12:36pm
  •  3cent
  • | Joined Sep 2006 | Status: Member | 103 Posts
a) you take both ( sell and buy ) signal situations into one phrase and this make it very unclear.

IMHO you cannot take lightly the buy/ sell signals. Explaining both oh them into one proposition is just that.

b)in the rules, you state that stochastics fast line must cross below the slow line ( short trade ) in order to consider the trade

after that, in the examples, you state that they must cross below 80 line.

they can cross from above , but not being below 80

which one is true and which one is being the rule : croosing between fast and slow line or the lines being below 80 line ( for a short trade) ?

c) if the trend resumes up ( which is true in most cases) and stoch are overbought ( also true in most cases) your fast line will cross over slow line in overbought territory.
what are you doing in that case, considering your system? wait for the trend to make a pullback again ?
(reconsidering a question from one reader before about trending against the trend)

d) your signal is basically given by a price breaking the 3 std dev BB. That is clearly to me a trending market.
In such a trending market you're waiting signals from an oscillator which all are known to give bad signals in trending markets and good signals in ranging markets.

thanks for your reply
The risk is what gives value to an investment.
 
 
  • Post #16
  • Quote
  • Nov 8, 2007 5:25am Nov 8, 2007 5:25am
  •  Kramer
  • | Joined Oct 2007 | Status: Member | 11 Posts
Quoting 3cent
Disliked
a) you take both ( sell and buy ) signal situations into one phrase and this make it very unclear.

IMHO you cannot take lightly the buy/ sell signals. Explaining both oh them into one proposition is just that.

b)in the rules, you state that stochastics fast line must cross below the slow line ( short trade ) in order to consider the trade

after that, in the examples, you state that they must cross below 80 line.

they can cross from above , but not being below 80

which one is true and which one is being the rule : croosing between fast and slow line or the lines being below 80 line ( for a short trade) ?

c) if the trend resumes up ( which is true in most cases) and stoch are overbought ( also true in most cases) your fast line will cross over slow line in overbought territory.
what are you doing in that case, considering your system? wait for the trend to make a pullback again ?
(reconsidering a question from one reader before about trending against the trend)

d) your signal is basically given by a price breaking the 3 std dev BB. That is clearly to me a trending market.
In such a trending market you're waiting signals from an oscillator which all are known to give bad signals in trending markets and good signals in ranging markets.

thanks for your reply
Ignored
3cent, thanks for your post!

Addressing your concerns in order:

a)

I’m not sure I understand your point – I don’t believe I gave a buy signal, or suggested that my charts indicated a buy signal? Perhaps you are referring to my reply to a post where I mentioned that although technically, there may have been a short signal, I chose not to take it? Not taking a trade because there was a particularly strong uptrend in place is hardly the same thing. If that is not the point you are referring to, I apologise, and would kindly ask you to explain your concern in a little bit more detail. Thank you.


b)

If I understand your question correctly, you are asking for clarification as to whether the cross of the K% line needs to occur above 80, and then for the lines to go below 80 before considering a trade, or whether we can consider a trade purely on the basis that the stochs have crossed above 80? If that is the case, I have already clarified this point in a previous post (no.14). As I noted in that post, I do normally like to see a cross from above 80, and the K% line breaking 80, although if the cross occurs in the 90’s, then I may take a trade prior to the K% line breaking 80. The 80 and 20 lines are not some magical level, beyond which a trade is doomed to fail. They just give an indication of whether a pair is overbought or oversold.

c)

What am I doing? In your example (stochs ducking under, then over the 80 line), the stochs would look a real mess, and I would stay well clear. Multiple crosses just under/over the 20/80 level are often a sign of price stalling/taking a breather, before heading back up (or down), and I stay away from this type of price action.

d)

You’re absolutely right, in a strong trending market, you need to be very weary of false signals on the stochs. This is exactly why I said, in my very first post, that an element of discretion is required prior to taking each trade. This is not a set and forget system, so you are wrong to say that ‘your signal is basically given’ by a break of BB3. It is the first step in a process. But thank you for raising a valid point which perhaps I should have spelt out rather more explicitly, which is that caution needs to be taken when looking at a potential trade which is against as strong trend.

I would make another point here. We are not concerned with taking every single trade which happens to meet our trade criteria. We are only after those A grade set-ups, and those which offer good risk:reward ratios. We are, in essence, looking for reasons not to trade, and messy looking stochs in a strong trend certainly tick those boxes.

Thanks for your post, 3cent, you raise some important issues. I’ve been trading this method for some time now, and perhaps I take for granted some of the nuances and degree of discretion required prior to pulling the trigger. I’ll try to post a few more chart examples, both of trades I did take, and didn’t, to try to illustrate this better.

I hope this helps, give me a shout if you need further clarification.

Kramer
 
 
  • Post #17
  • Quote
  • Last Post: Mar 2, 2019 12:12pm Mar 2, 2019 12:12pm
  •  enny8
  • | Joined Apr 2016 | Status: Junior Member | 1 Post
I know this is a very old thread. But I just wanted to say I have found this multi-timeframe Bollinger Band confluence trading to work very much for me on equity trading. Thanks Kramer!
 
 
  • Trading Systems
  • /
  • Bollinger Band Confluence Trading
  • Reply to Thread
0 traders viewing now
Top of Page
  • Facebook
  • Twitter
About FF
  • Mission
  • Products
  • User Guide
  • Media Kit
  • Blog
  • Contact
FF Products
  • Forums
  • Trades
  • Calendar
  • News
  • Market
  • Brokers
  • Trade Explorer
FF Website
  • Homepage
  • Search
  • Members
  • Report a Bug
Follow FF
  • Facebook
  • Twitter

FF Sister Sites:

  • Metals Mine
  • Energy EXCH
  • Crypto Craft

Forex Factory® is a brand of Fair Economy, Inc.

Terms of Service / ©2023