Hello
I've been trying a lot of new things lately.
But remember, the curves are the only real wealth.
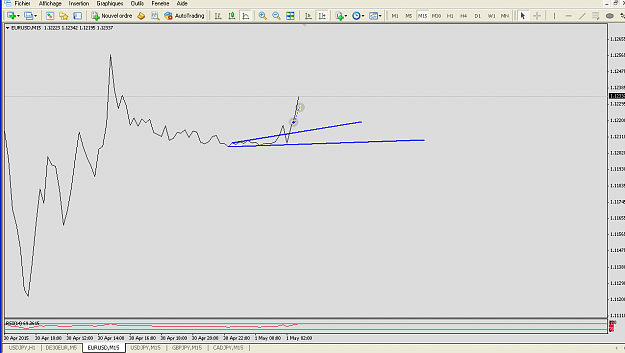
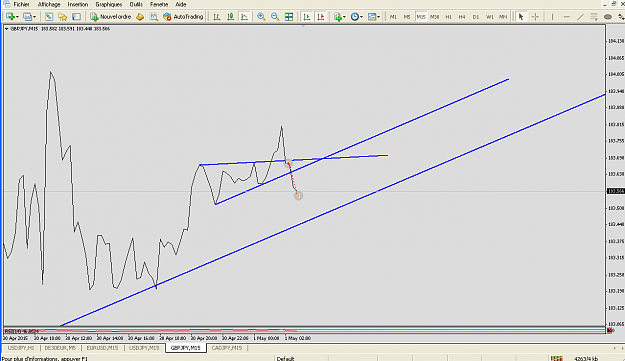
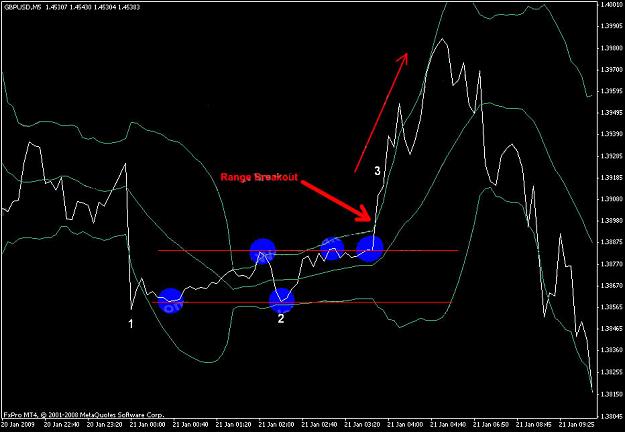
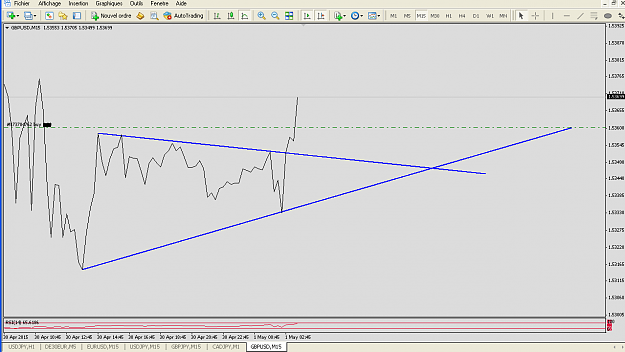
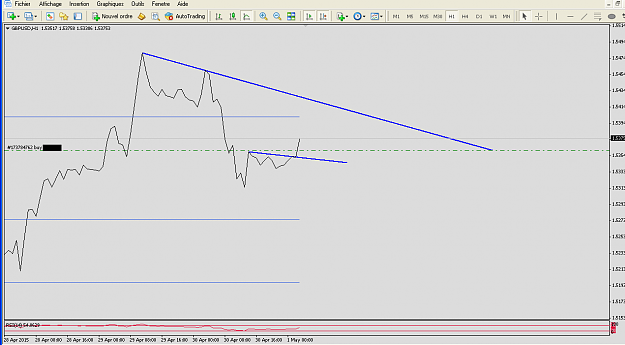
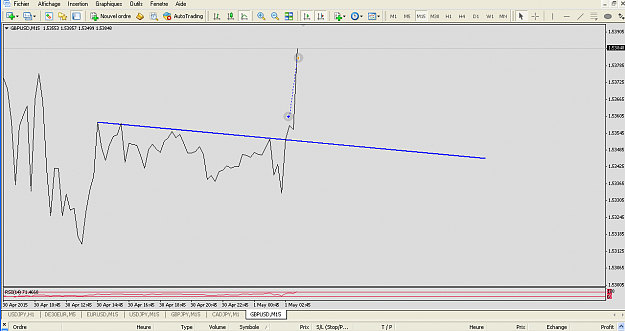
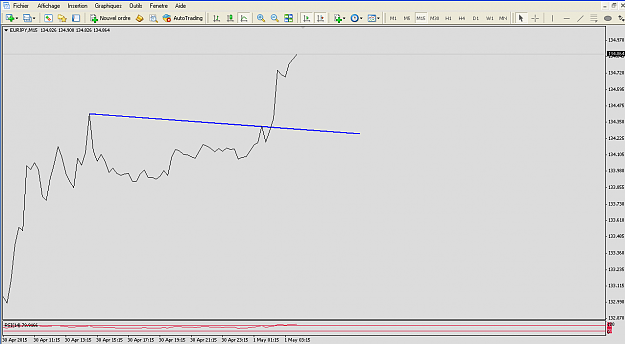
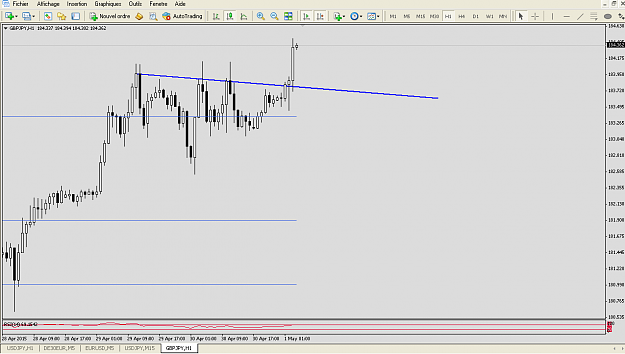
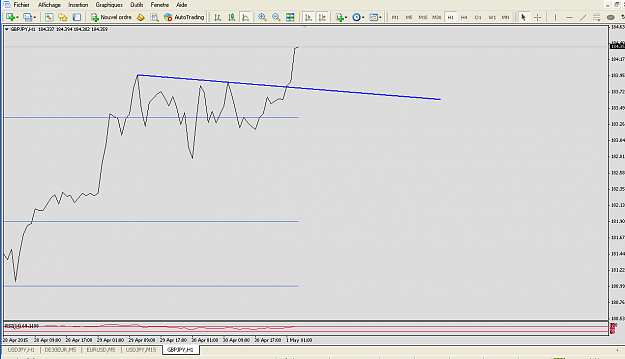
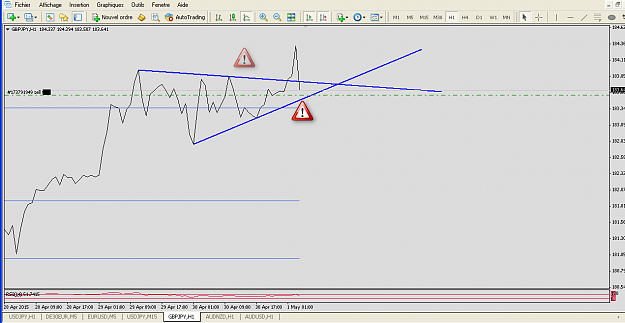
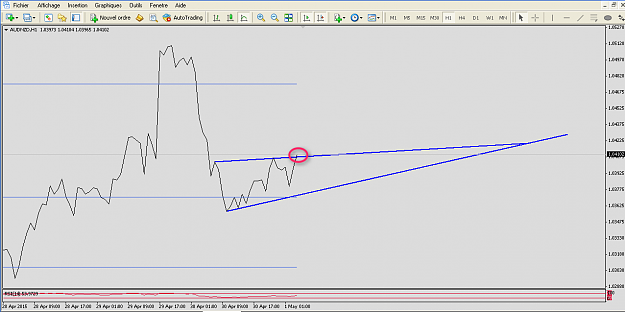
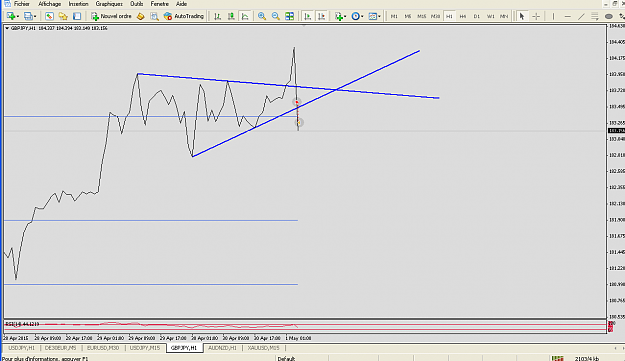
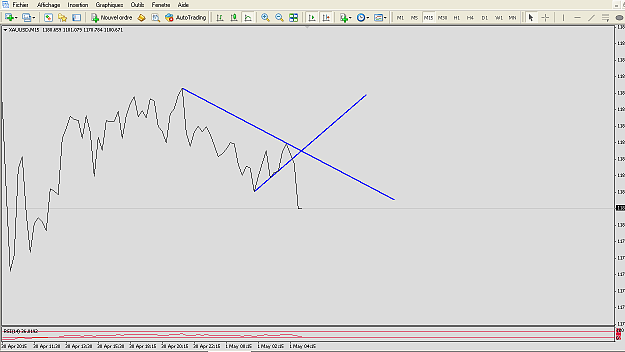
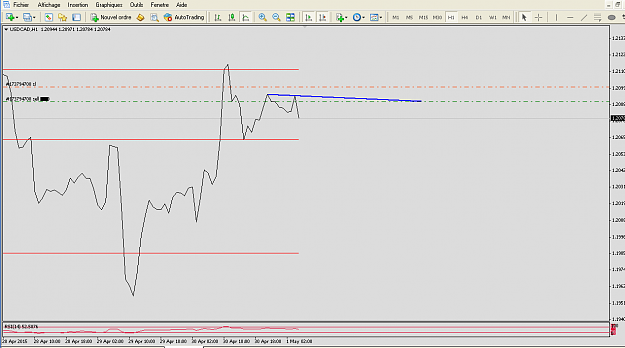
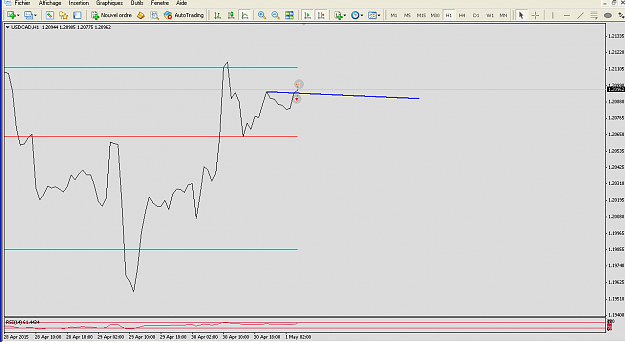
The above breakout could be the beginning of a big trend, but it is not. I just brought it here as an example of ranging market and its breakout. If the candlesticks movements make you confused, you can shift to the line chart from time to time and find the real support and resistance of the range. Line chart is plotted based on the close signal. Close signal is the most important thing specially when you want to interpret the signals with Bollinger Bands and predict the market. Let’s shift to line chart and see how it looks like:
I've been trying a lot of new things lately.
But remember, the curves are the only real wealth.
The above breakout could be the beginning of a big trend, but it is not. I just brought it here as an example of ranging market and its breakout. If the candlesticks movements make you confused, you can shift to the line chart from time to time and find the real support and resistance of the range. Line chart is plotted based on the close signal. Close signal is the most important thing specially when you want to interpret the signals with Bollinger Bands and predict the market. Let’s shift to line chart and see how it looks like:
Attached Image(s) (click to enlarge)