HAPPY NEW YEAR AND GOOD LUCK TO EVERY ONE!!!!!
I need help with following request:
I have attached 3 images below,
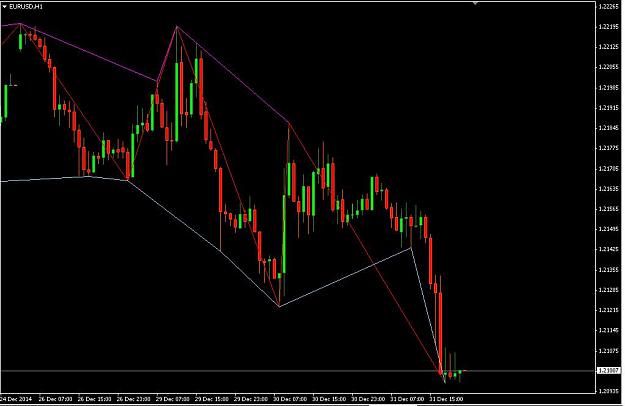
Image 01-ZigZag SG, Which draws a normal Zigzag and Trend Line.
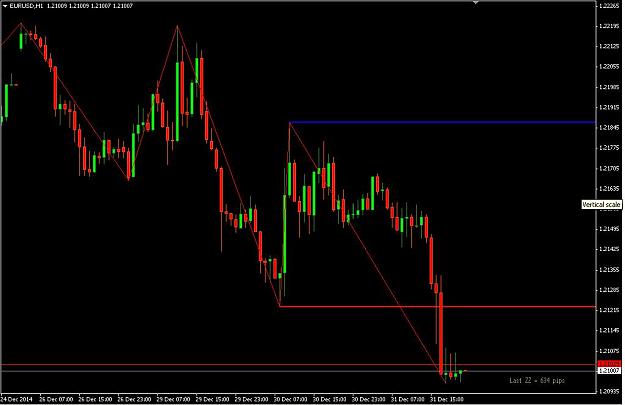
Image 02-Zigzag_with_line_at_lows_and_line_at_highs, which draws a normal Zigzag
With Low And High Zigzag too.
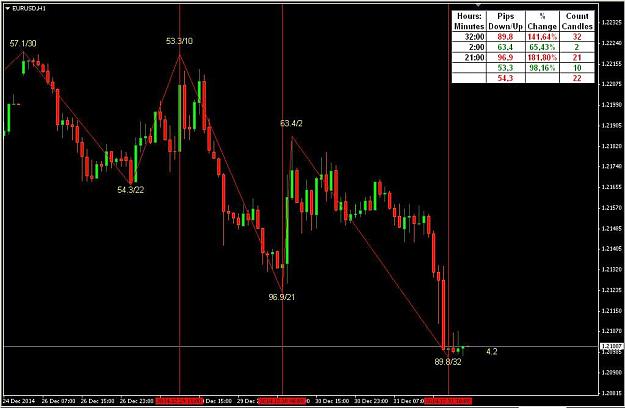
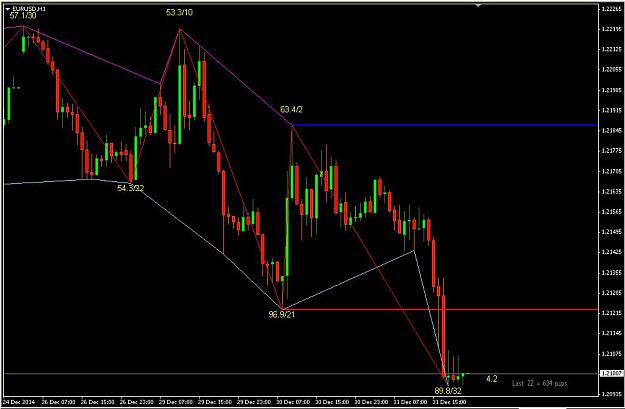
Image 03-ZigZagWithValue_Bars, draws Zigzag and print pips value of the Zigzag and Counts the number of Candles.
Attached 3 individual Indicators also, all indicator parameters are set to 12-5-3
on H1 time frame, which must be changed and should work on other time frames too.
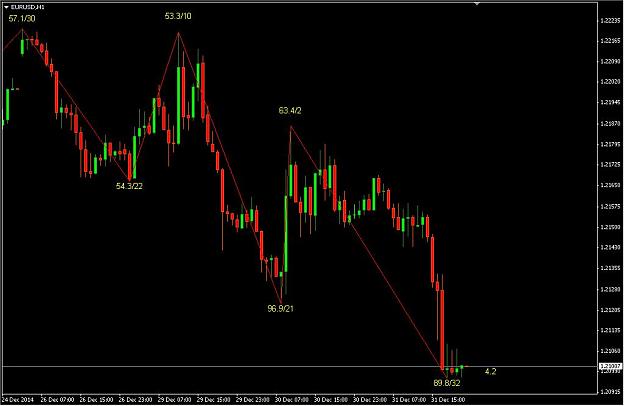
I want to Combined 3 Zigzags In 1 as shown in the picture 04-All 3 indicator In One (and having the option to view them all or hiding any to view separately 1, 2 or all 3 of them).
Thanks and Regards,
Moti
I need help with following request:
I have attached 3 images below,
Image 01-ZigZag SG, Which draws a normal Zigzag and Trend Line.
Image 02-Zigzag_with_line_at_lows_and_line_at_highs, which draws a normal Zigzag
With Low And High Zigzag too.
Image 03-ZigZagWithValue_Bars, draws Zigzag and print pips value of the Zigzag and Counts the number of Candles.
Attached 3 individual Indicators also, all indicator parameters are set to 12-5-3
on H1 time frame, which must be changed and should work on other time frames too.
I want to Combined 3 Zigzags In 1 as shown in the picture 04-All 3 indicator In One (and having the option to view them all or hiding any to view separately 1, 2 or all 3 of them).
Thanks and Regards,
Moti
Attached Image(s) (click to enlarge)
Attached File(s)