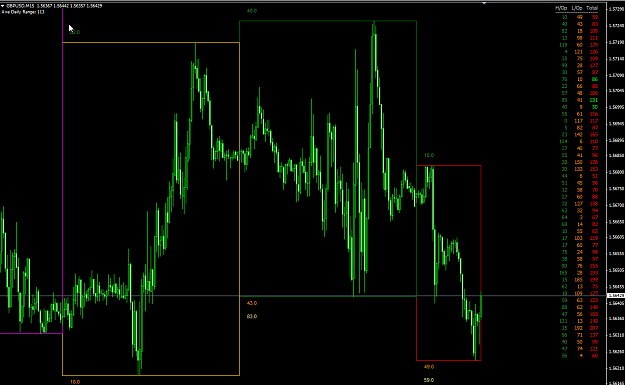
The amazing indicator (Range_DAYS v2) is created by cja result image is attached also.
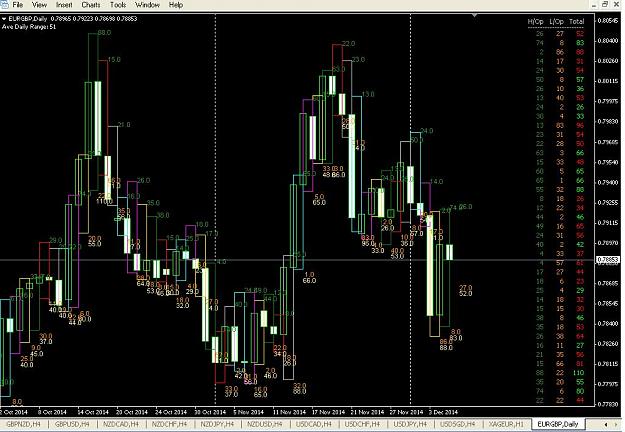
For example the indicator writes the pips information on the screen and plot information’s correctly for selected period as per inputs.
My question is do exist any indicator the collect the plot information and pass to .txt or .xls file as shown in the table below.
Pips up to Open price----Pips down to Open price------Total Pips
-----------14-----------------------------14-------------------------28
-----------30-----------------------------57-------------------------87
-----------76-----------------------------10-------------------------86
-----------22-----------------------------66-------------------------88
-----------57-----------------------------48-------------------------105
-----------89-----------------------------41-------------------------130
Thanks And Regards,
Moti
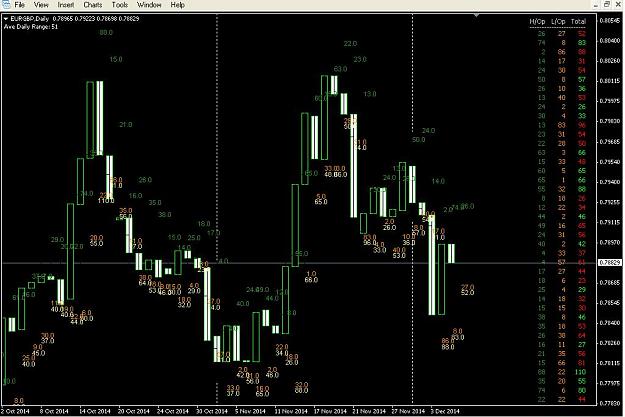
Attached Image

Attached File(s)