|
Commercial Member
|
Joined Apr 2013
|4,366 Posts
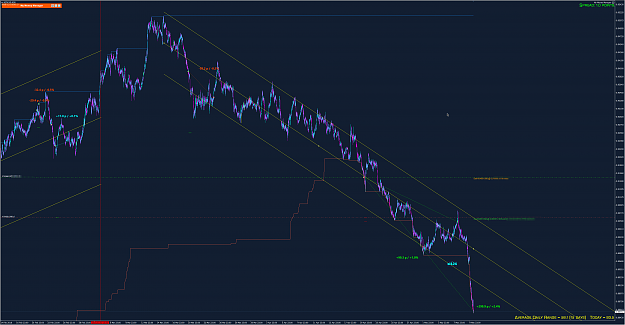
For those that like Visuals and a way to possibly get rid of the Donchians.....A thought bubble applied in practice
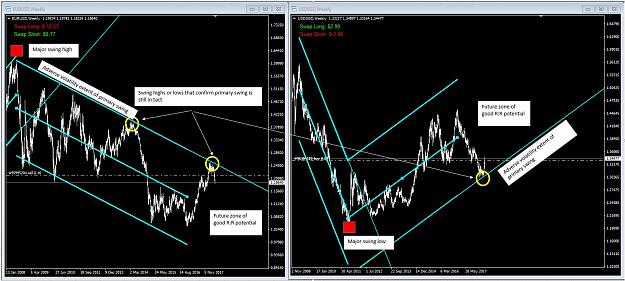
This post got a bit of traction as I think it helps those who trade by swing or momentum to decipher which swings have potentially the greatest reward to risk potential. In other words.....from the huge number of swings present in any timeframe....our central assumption is that some swings are more important than others in terms of the serial correlation that may be present at particular zones of overall market structure.
So here are two charts below that I have assumed offer great risk to reward opportunities given the current positioning of price in relation to my interpretation of market structure using higher timeframes.
Attached Image (click to enlarge)
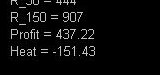
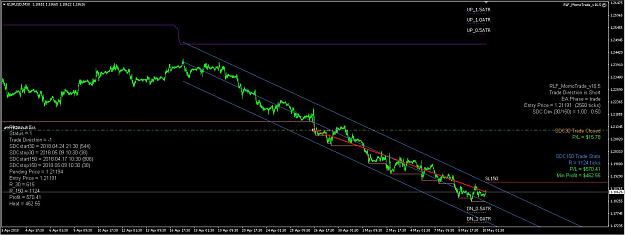
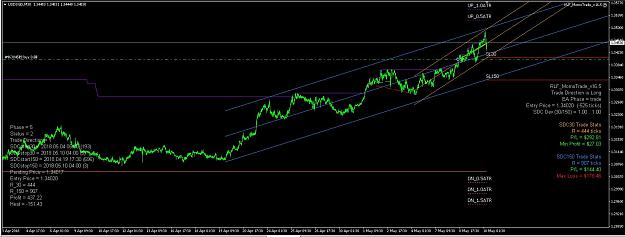
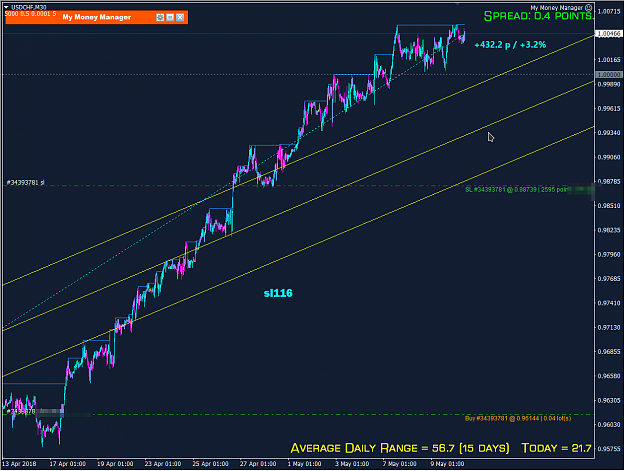
So now you have the context....that's why I am locked and loaded on EURUSD and ESDSGD and have been looking at M30 to configure my opportunities in this regard. I am trading what I interpret of the significant swings of high R:R potential. Here is the status of the live trades.
Attached Image (click to enlarge)
Attached Image (click to enlarge)
Now the question is. ...Luck or market logic? Spooky isn't it? :-)
the best village on the planet except for last weekend being Mardigrass even had the riot squad and swab tests on all roads in and out
Ignored
I had to laugh on the Mardigrass ;-)
Hard to disagree on that mate. Sure beats the incessant heat of the concrete jungle up here. It is coming up to the end of the financial year and the cops are probably trying to balance their budget. Nimbin is a great soft target cause everyone is so relaxed....so to speak. All those deep breathing exercises....oh and also the yoga :-)
For those that like Visuals and a way to possibly get rid of the Donchians.....A thought bubble applied in practice This post got a bit of traction as I think it helps those who trade by swing or momentum to decipher which swings have potentially the greatest reward to risk potential. In other words.....from the huge number of swings present in any timeframe....are some swings more important than others in terms of the serial correlation that may be present at particular...
Ignored
Interesting stuff C... I am repenting coming here. The more the read, the more I am getting OCD into this sh*t LOL
Could I ask the logic/calculation behind the "heat map" feature? Do you have one EA running multiple strategies or one EA per strategy (via input parameter)?
It's bit of challenge for me to assess and compare equity heat/performance of my EA running in one account against the same EA running in another account in another MT4 terminal instance on the same laptop. It's already overloading the CPU since the last account creation. I just bought a small tabletop fan to keep it cool. I also had to disable my ProfitManager and LossManager functions to reduce overload. Thinking this further, they are no longer required now that my DrawDownManager is capable to handling both the functions with downward protection and unlimited upward growth. I think I might have to patent this design :-)
{quote} Interesting stuff C... I am repenting coming here. The more the read, the more I am getting OCD into this sh*t LOL Could I ask the logic/calculation behind the "heat map" feature? Do you have one EA running multiple strategies or one EA per strategy (via input parameter)? It's bit of challenge for me to assess and compare equity heat/performance of my EA running in one account against the same EA running in another account in another MT4 terminal instance on the same laptop. It's already overloading the CPU since the last account creation....
Ignored
Hi V
The heat map mate is a dashboard that simply summarises some of the key features of the entire fixed universe we use on a single brokers platform (in this case Pepperstone) and the status of each of the instruments. For example whether pending orders have been established (Pend) and are yet to be activated or whether the trade is live (Live) or whether the instrument has no defined status (Inact).
The Dashboard ranks the instruments by Buy status or Sell status in the context of where price lies in relation to the Donchian we apply to our strategy. The ranking has gone through many different iterations depending on the features we are looking for to rank the potential prospects of that instrument. We include spread and SWAP for the following reason. It gives us a last minute basis for decision making to enter live trades dependent on the frictional costs at the time. There are lots more things we plan to do with this dashboard and it is a work in progress. It's chief objective is to reduce our screen time and alert us to upcoming factors we need to be aware of.
An EA is attached to each instrument when you select an instrument from the dashboard. The result is that only live or pending trades remain active on our screens to reduce the grunt required to run the entire portfolio system as opposed to having each instrument in the portfolio active on the screen. Global variables store this info so if the platform goes down, it's reopening will restore all settings held by global variables.
The chart for each instrument includes an attached EA that calculates the heat for each live instrument and also manages all trade activity post entry. Discretion is only available through pending order placement for entries which entails defining the commencement swing of the SDC and the horizontal line placement of the pending order on the chart.
Heat represents the worst case scenario from current price to our trailing stop of that instrument. The Dashboard then summates the heat for all active trades. When the trailing stop gets above breakeven for that instrument we get positive heat that creates a benefit for the portfolio condition. In this way we use the unrealised profits of the portfolio to scale up in terms of live trade activity.
That's about it mate....but we have a long way to go in the design. It has sufficient scalability by VPS to allow up to 100 active instruments at once without having to split the operation into several MT4 account instances etc.
When we take a live trade on a single instrument we actually take two trades at once. One trade is configured to address the most recent momentum of the time series where the latter trade is used to address the overall longer term momentum of the entire data series we capture in our swing segments.
Behind the scenes a csv file is capturing all live trade activity which we then dump into a database for later retrieval for analysis functions and comparison against backtests.
{quote} Hi V The heat map mate is a dashboard that simply summarises some of the key features of the entire fixed universe we use on a single brokers platform (in this case Pepperstone) and the status of each of the instruments. For example whether pending orders have been established (Pend) and are yet to be activated or whether the trade is live (Live) or whether the instrument has no defined status (Inact). The Dashboard ranks the instruments by Buy status or Sell status in the context of where price lies in relation to the Donchian we apply...
Ignored
Thanks. It helped quite a bit to understand your overall approach. It seems I will have to do something similar for my design but no visuals for me! I have gone completely dark on my screen to avoid the "see something do something" nightmare I was dealing with. Now I see nothing and do nothing with entries (and almost 90% of my exits) to remove emotions out of my trading.
I have bugged you enough this week so thanks for your patience.
For those that like Visuals and a way to possibly get rid of the Donchians.....A thought bubble applied in practice This post got a bit of traction as I think it helps those who trade by swing or momentum to decipher which swings have potentially the greatest reward to risk potential. In other words.....from the huge number of swings present in any timeframe....our central assumption is that some swings are more important than others in terms of the serial correlation...
Ignored
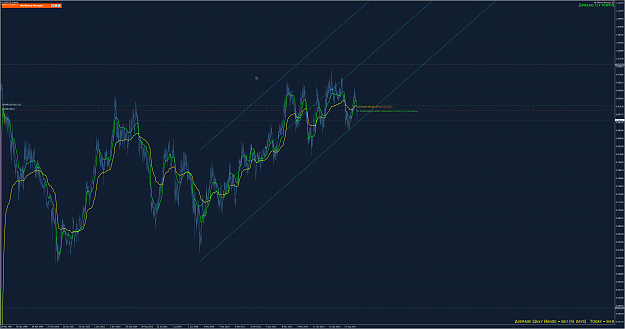
So let's look at NZD CAD with Kaufmann's MA:
Attached Image (click to enlarge)
According to this we don't have much conviction that NZDCAD will continue lower?
Cut short your losses. Let your profits run on. David Ricardo (1772-1823)
{quote} So let's look at NZD CAD with Kaufmann's MA: {image} According to this we don't have much conviction that NZDCAD will continue lower?
Ignored
The Kauffman MA perhaps would be a good indicator to measure the strength of momentum *once* we have filtered our trade selections to the setups with the highest R:R probability.
The market structure approach perhaps provides a basis to first focus on the anticipated momentum surges that have the greatest potential attributed to the optimal position sizing to achieve the biggest bang for buck in our universe. At the moment with our ranking systems we are spoiled for choice....but the market structure approach (needs to be tested) potentially provides a way to navigate through this issue providing a more robust smaller selection of candidates from a dynamic universe.
The idea shooting around my head is the assumption that a dynamic universe is better than a fixed one. We are on the same page here. Under that assumption we then have the inevitable fight in terms of which instrument we select in our asset groupings and how many. At the moment our assessment is based on our estimate of the momentum that is present in the price series and the correlation of that instrument to the live portfolio.
I was considering introducing an introductory step (by a longer term market structure analysis) to first assess the trade potential in terms of risk-weighted terms before we come to the stage of selection by momentum. In that stage we already have an inbuilt factor that relates to the short term momentum characteristics and the long term momentum characteristics. If we deploy the Kauffman filter for assessing the momentum signal, we just need to ensure it adds genuinely new information to that logic or is it something that is better represented by our short term and long term trade approach using the SDC's.
Just thinking around mate......nothing is written in stone and every assumption needs to be tested. :-)
{quote} The Kauffman MA perhaps would be a good indicator to measure the strength of momentum *once* we have filtered our trade selections to the setups with the highest R:R probability. The market structure approach perhaps provides a basis to first focus on the anticipated momentum surges that have the greatest potential attributed to the optimal position sizing to achieve the biggest bang for buck in our universe. At the moment with our ranking systems we are spoiled for choice....but the market structure approach (needs to be tested) potentially...
Ignored
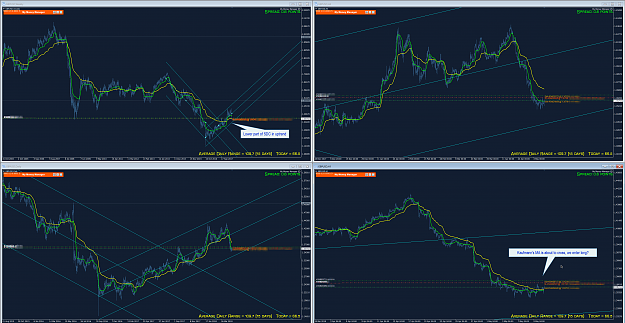
OK, so let's do preliminary framework to discuss:
A. Entry:
1. Draw SDC on weekly.
2. Look for markets which are in lower part of SDC in trend up and vice versa
3. I put daily and 4h to show how it looks. Daily SDC up, 4h SDC would be down.
4. KAMA cross on 1h would be entry signal according to weekly SDC.
5. 1h SDC would be down now.
Attached Image (click to enlarge)
B. Initial SL:
1. Weekly SDC?
C. Trailing:
1. SDC drawn on hourly from last low/high.
I don't think this is closer to automation, as you need to assess on weekly the best SDC *AND* its Standard deviation....
Inserted Video
Inserted Video
Cut short your losses. Let your profits run on. David Ricardo (1772-1823)
{quote} OK, so let's do preliminary framework to discuss: A. Entry: 1. Draw SDC on weekly. 2. Look for markets which are in lower part of SDC in trend up and vice versa 3. I put daily and 4h to show how it looks. Daily SDC up, 4h SDC would be down. 4. KAMA cross on 1h would be entry signal according to weekly SDC. 5. 1h SDC would be down now. {image} B. Initial SL: 1. Weekly SDC? C. Trailing: 1. SDC drawn on hourly from last low/high. I don't think this is closer to automation, as you need to assess on weekly the best SDC *AND* its Standard deviation.......
Ignored
Great ideas R....but let's work on the detail a bit over the next week or so and thrash it around.
Ideally we use the weekly TF simply to provide the context for our trades. The main idea is that we are trying to position our entries to as close as possible to a significant new swing move in the direction of the primary swing of W1 where we assume momentum in terms of sharp swing reversals is strongest. This provides a filter to significantly reduce our potential hit list from any dynamic universe and an associated logic we can objectively test for the future.
We then move down to our timeframe of choice (eg. M30 or D1) that still makes life easy for us but avoids excessive SWAP of holding costs. We want to be in and out with strong momentum moves. That allows us to take a few bites of the cherry as opposed to suffering the symptoms of SWAP build up on long lazy trends.
In regards to our trailing stop.....the reality is that to achieve optimal position sizing the W1 trail is not advisable. In fact I would argue we don't need it. Given the history of this thread we know that the SDC is the optimal tool and the setting at 1.0 is not used to encompass the entire volatility of the data series....but rather.....to optimally achieve trade efficiency. This is in part attributable to what the Kauffman filter is trying to achieve. The 1.0 SDC gives us a constrained channel that demands that a strong signal strength is maintained across the entire data series if possible. Too much noise....and bang....we are out....which is exactly what we want.....so I think we have nailed the trade execution and trade management process already.
The multiple short term and long term trade entry is also ideal and a significant improvement to the model as it is forcing a condition of building momentum on entry. It is not that we adopt a breakout model for the sake of it....but rather that momentum is on the increase when we enter the trade. That is critical for our success.
Does the Kauffman crossover give us an edge in entry selection? It looks like it might which will be another string to the bow.....but perhaps it is better used on the W1 timeframe for defining when to drill down to the lower timeframe to execute?
....something like this mate....but between you and me...we can come up with something to progressively take us closer towards full automation.
I was speaking with the man from Turkey's hedge city today and he has some great ideas in terms of being able to definitively plot market structure on W1....but he won't be able to get to it for a bit....however once we nut this out we need to get together and spec it out for development.
The good thing is that our default position is what we have already. We are cleaning up and the backtest concludes that our variables are standing up for the last 8 years. Any changes we make must be done on the basis of:
1. Does it lead us closer to full automation; and
2. Does it deliver better sustainable risk-weighted returns.
{quote} Great ideas R....but let's work on the detail a bit over the next week or so and thrash it around. Ideally we use the weekly TF simply to provide the context for our trades. The main idea is that we are trying to position our entries to as close as possible to a significant new swing move in the direction of the primary swing of W1 where we assume momentum in terms of sharp swing reversals is strongest. This provides a filter to significantly reduce our potential hit list from any dynamic universe and an associated logic we can objectively...
Ignored
Great ideas!
1. I was thinking that this is Reverter replacement or convergent element....but without TP. It is not supposed to be breakout model.
2. 1h timeframe would add diversification benefit
Inserted Video
Cut short your losses. Let your profits run on. David Ricardo (1772-1823)
{quote} Great ideas! 1. I was thinking that this is Reverter replacement or convergent element....but without TP. It is not supposed to be breakout model. 2. 1h timeframe would add diversification benefit https://www.youtube.com/watch?v=gHrbOlKiD1Y
Ignored
Definitely R (even more reason for this exercise).....Even if it does not offer any substantive improvement on our current primary model plus reverter...it will be useful as an additional system for diversification purposes. I liked that Paul Cardall piece mate. Here I am on a high and then you chill me down. It has a bit of the Secret Garden vibe about it.... :-)
{quote} Definitely R (even more reason for this exercise).....Even if it does not offer any substantive improvement on our current primary model plus reverter...it will be useful as an additional system for diversification purposes. I liked that Paul Cardall piece mate. Here I am on a high and then you chill me down. It has a bit of the Secret Garden vibe about it.... :-)
Ignored
Don't smoke this crap and you not will be high /just teasing.
Cut short your losses. Let your profits run on. David Ricardo (1772-1823)