why is dax so dead all my trades today I lost on dax and made it up on gbpy jpy
Ignored
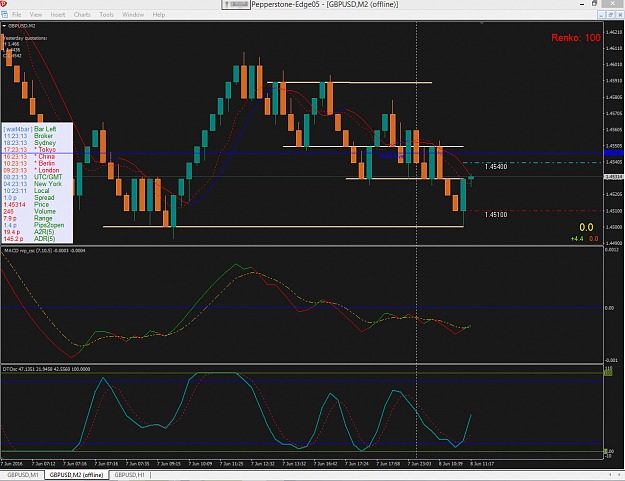
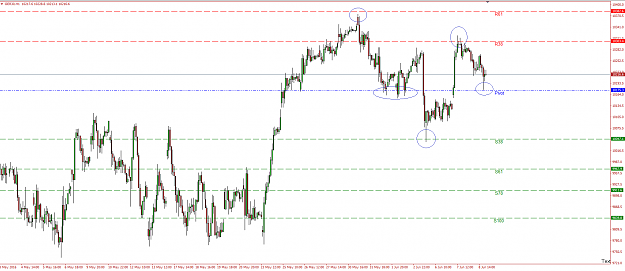
Hardly dead, it made a 170+ pip move up this morning, but looks like it ran out of steam. Now looks like a 123 reversal, if my theory is correct. It was dead yesterday as we had a consolidation day.
Best, Josh
{quote} Hardly dead, it made a 170+ pip move up this morning, but looks like it ran out of steam. Now looks like a 123 reversal, if my theory is correct. It was dead yesterday as we had a consolidation day. Best, Josh {image}
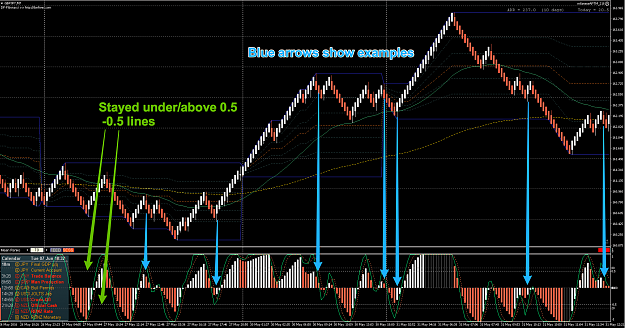
{quote} I've settled on the JRSX and Stoch indicator's. The JRSX really helps me gauge strength and spot divergences better than the mac-d (if it's above or below the 0.5 level the swing has more strength, and if it's within the 0.5 levels it's weak.) I like to see weak pullbacks and hop on for the ride. I agree that the stoch can give repetitive clues as to what price is doing. .
Ignored
Hey Keith, please post examples of what you mean by weak pullpacks, thanks,
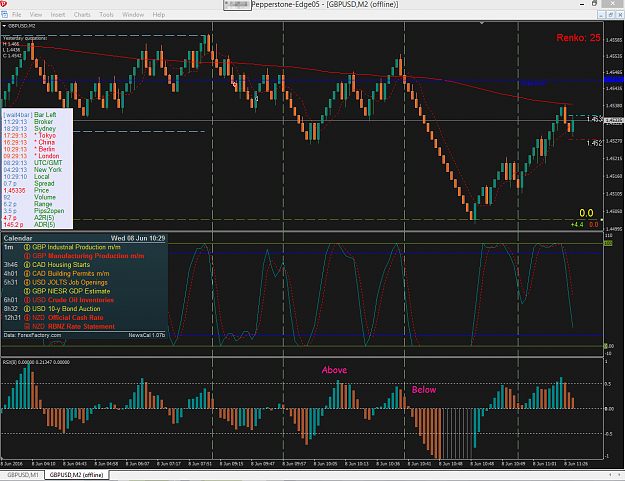
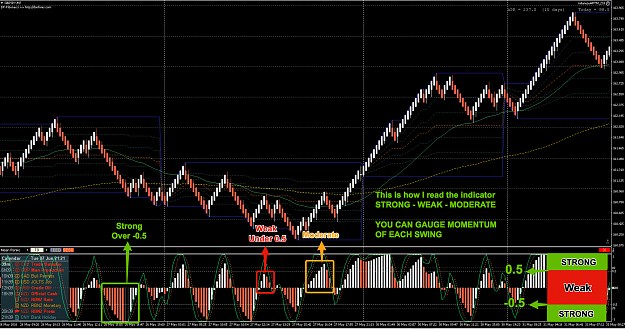
{quote} Here is a little more detail. I add each swing together to estimate what the next swing could do (along with reading price action HH HL LH LL). For example: Moderate down - Weak up = Short Strong up - Strong down - Weak up = Short Again, this all makes sense in my head so hopefully it's coming across correctly. {image}
Ignored
Thanks, I see you are no longer a captain America fan
What I get is once you determine a bias, you use the JRSX to gauge if the pull back is temporary as in the bias is going to resume by how far the reading is -below 0.5 means the bias is likely ending, and above 0.5 means the move is likely resuming.
Something like that?
Ger30 +20 - went in for a quick 20.... I missed a second entry as I was annotating the chart..oh well. I did not follow the Divergence at BRN as I felt my 123 setup i posted yesterday was still in effect. Once it failed, i got in. I am also looking to replace the MACD, maybe with something more visual...or improve my language reading skills as sometimes i don't hear well what this one is saying. Best, Josh
{quote} Thanks, I see you are no longer a captain America fan What I get is once you determine a bias, you use the JRSX to gauge if the pull back is temporary as in the bias is going to resume by how far the reading is -below 0.5 means the bias is likely ending, and above 0.5 means the move is likely resuming. Something like that?
Ignored
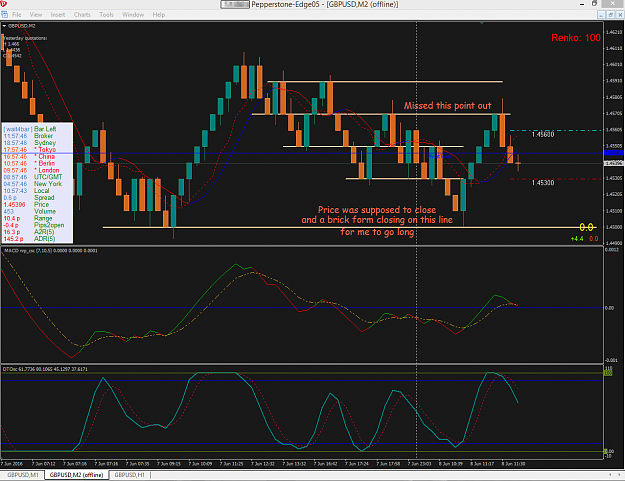
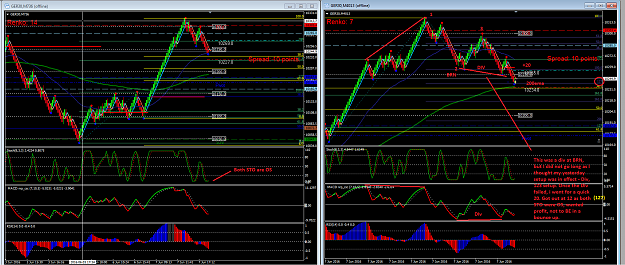
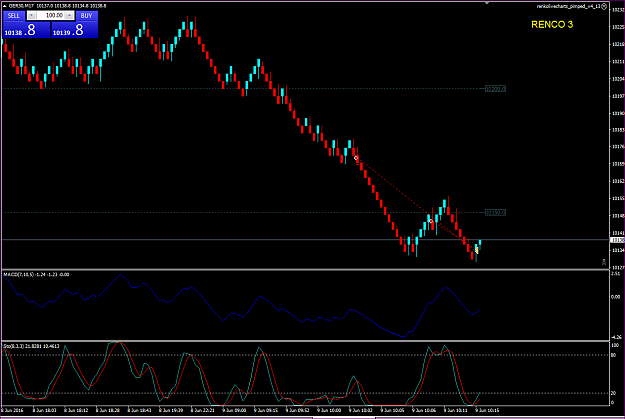
Something like this, I took a short from Renko 5 but agonized that my entry was 15 pips after the descent started, got out as my system was freezing (must have been internet connection)
I drilled down to the Renko 2.5 to see how the JRSX would look with your explanation it looks like I would have been done with trading profitably for the day.
Tell me what you think?
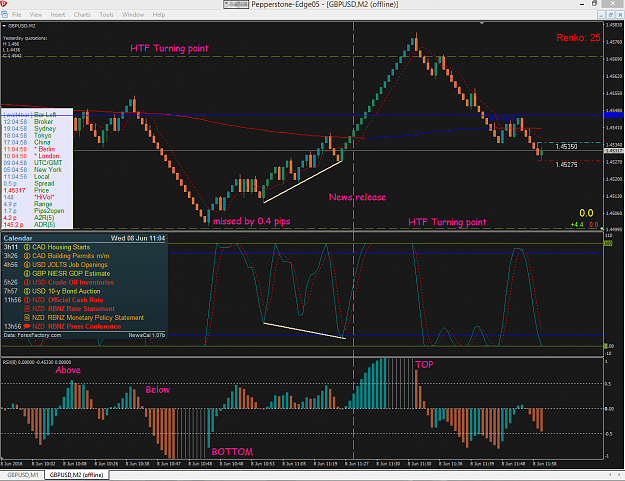
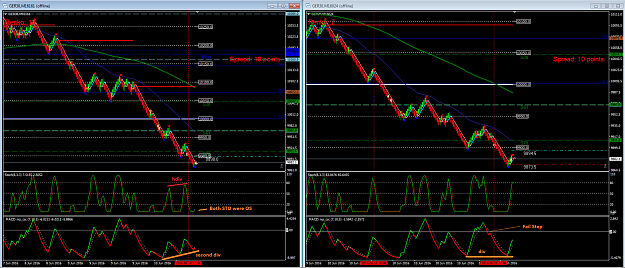
{quote} Do you think this can help catch tops and bottoms? {image} {image}
Ignored
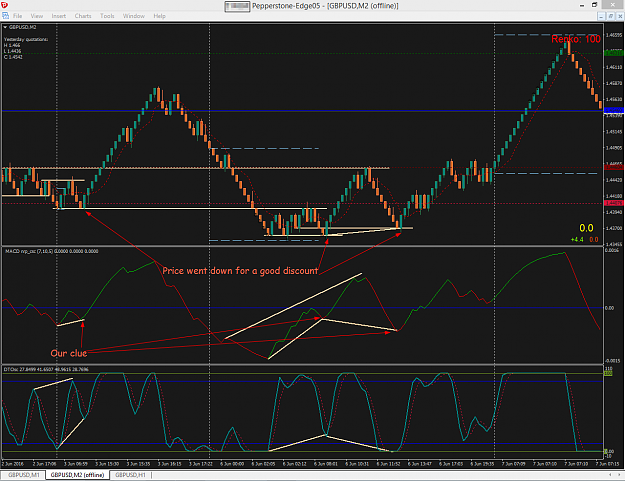
I might be on to something here, because the MMs give the big dogs discounts and those areas I think are the turning points in the market and our clues to jumping in is divergence in the HTF and LTF, you can check your HTF charts (especially Renko 10) and see if you can spot the ping pong.
It does not repeat every single day but I'm seeing that before most of the big moves, prices are either pushed up higher for a great fall or pushed lower for a great rally.
{quote} Hey Friska, good to see you mate. I am not sure you remember me as I didn't actively post much earlier in the thread, but I have read your post here and really like your trade logic. Best, Joshua
Ignored
hey!
of course I remember buddy!!
I see you're doing well here, keep it up !!
{quote} Here is a little more detail. I add each swing together to estimate what the next swing could do (along with reading price action HH HL LH LL). For example: Moderate down - Weak up = Short Strong up - Strong down - Weak up = Short Again, this all makes sense in my head so hopefully it's coming across correctly. {image}
Ignored
I have been testing Davit's Pivots this week, and so far it looks sweet.
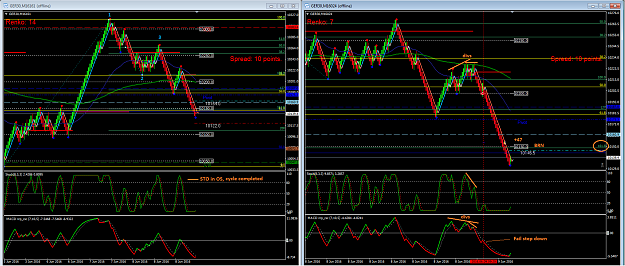
Ger30 +47
Before taking this, i was debating about what is happening on the chart. There were two scenarios that i saw. Now, yesterday we had a failure to launch from a 38.2% retracement leading to a big 123 down. This took us to 61.8% retracement where we were this morning.(also 127% ext of the big 123)
So if, the uptrend was to continue, this would be the area the PA should show some signs of bullishness. I saw none, but only bearish signals. The logical target then became the 161.8% extension of 123 and 200%(i only used one contract so 161.8 at BRN was used).
Also, please note - and I say this with no ego - i did fail to act on the big 123 yesterday as I saw too late what was happening....but getting better at seeing.
I was looking for a 123 up, but conditions to take the trade never came, and when i saw whats happening, i was too slow to respond.
now that I have traded dax live I can only say this ...I don't think you can trade with renkos only you must also look at your time charts because there is a lot of ambiguity in the renkos ....a double bottom can also be a 123 ...how can you judge with renkos only the direction of the market ..???? I really don't know how dee50 does it ....but with time bars you can see a wide bar and a narrow bar .....everytime I took a trade with renkos only I lost money but when I look at the time charts together with renkos I made money
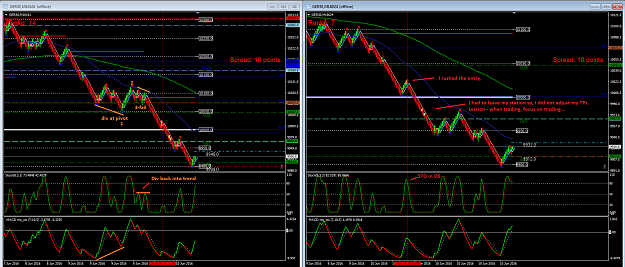
Ger30 +40 +46 - I had to leave the house so I rushed my entries - made on 1 min after a pin bar. I was expecting it to turn here and wanted to get in before I go. I should have waited for confirmation, close below ma with macd in red. I was late for the initial move as it was. I set my TPs to the next pivot and left, came back to profit. In retrospect, despite how well this worked out, it was undisciplined in both entry and exit. I should have waited for confirmation for entry and I should have estimated my TPs better. I made the decision for the TP on the smaller TF chart. Lesson for me here is that when trading, focus on trading, not other crap.
I decided to add the pivots to my charts as GER30 seems to follow them very well.
Best, Josh
now that I have traded dax live I can only say this ...I don't think you can trade with renkos only you must also look at your time charts because there is a lot of ambiguity in the renkos ....a double bottom can also be a 123 ...how can you judge with renkos only the direction of the market ..???? I really don't know how dee50 does it ....but with time bars you can see a wide bar and a narrow bar .....everytime I took a trade with renkos only I lost money but when I look at the time charts together with renkos I made money
Ignored
Hey Bettervolume,
If you make money that way, thats what you should focus on and thats whats important. I think Dee also had a regular chart open on the side to look for pin bars etc.
-A double bottom can not be a valid 123 in my book, if the retracement is far bellow 61.8%, i would re-evaluate my 123 theory and whats going on on the chart.
Ultimately, its important to take pips.
Best, Josh
GER30 +25 Went in for a quicky. I got in a second too late, but market started to move fast. I got out as i started seeing a second divergence print on the htf and ltf, both STO were OS. Wanted to secure profits.