Having more than one chart on different timeframes helps to more accurately identify possible support/resistance levels and the reasons why price behaves in a certain way.
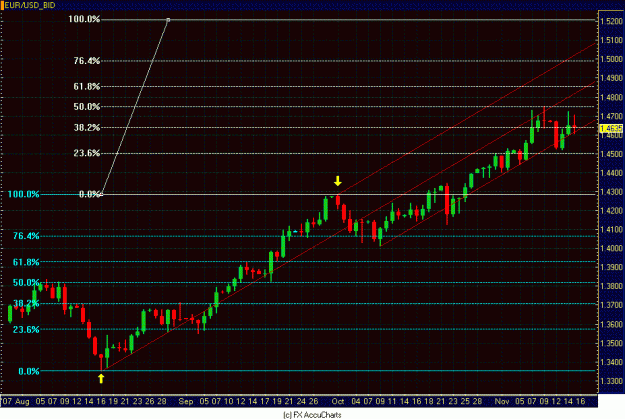
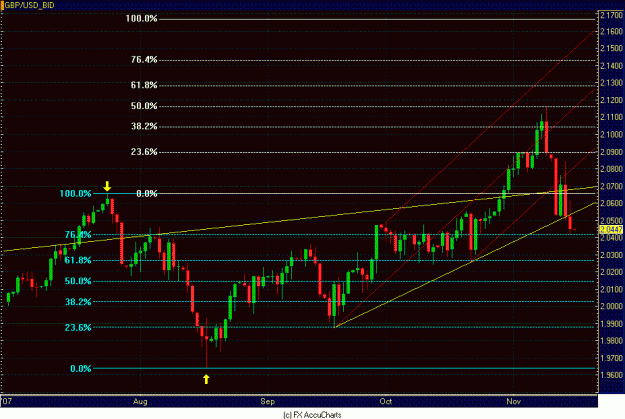
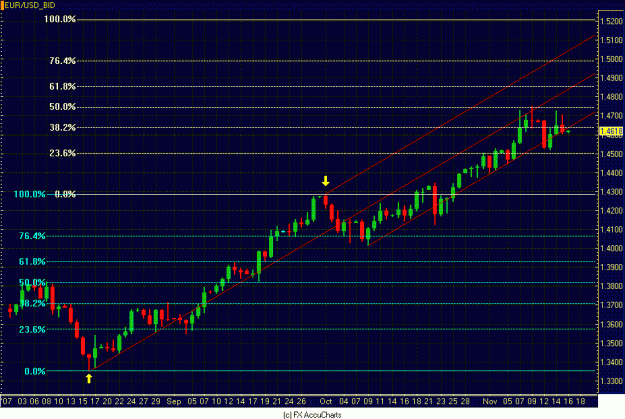
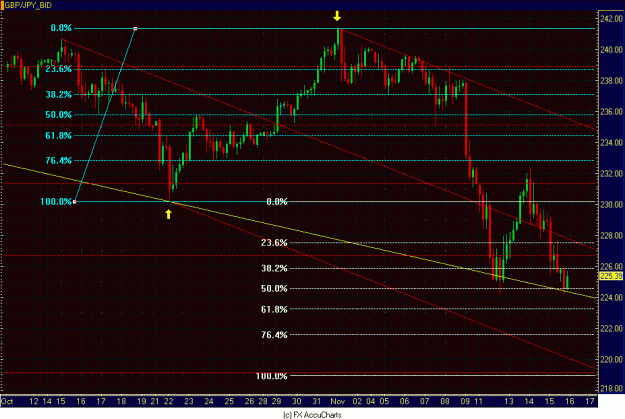
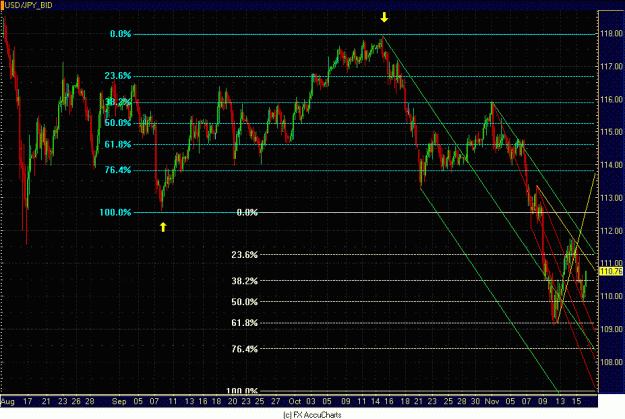
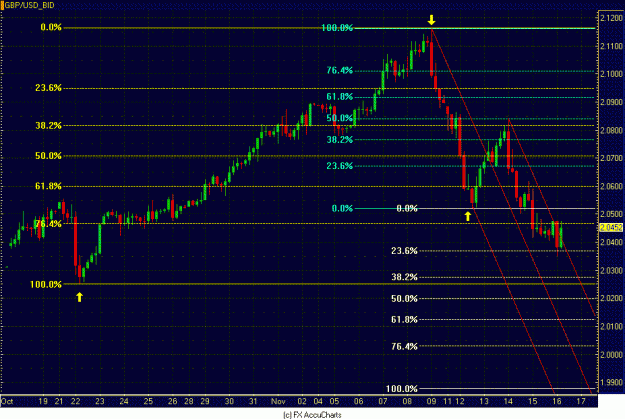
Whenever you see two different sets of fib lines directly above/below each other, one will always be the duplicate of the other. The high and low for the range the original set is drawn on is usually indicated by the yellow arrows on the chart (sometimes I forget to include them). If they are not included, it should be easy to determine the range for the original set by just viewing the chart The 0%/100% fib line on one set should always conicide with the 100%/0% on the other at the high or low of the range (unless I have the fib lines drawn different for the purpose of showing an extension). If you see a closeup of a chart which doesn't show how the lines are drawn, you should be able to find the expanded chart in one of the more recent posts. Going forward, I will just post the expanded chart along with it. I was just trying to keep from posting too many charts.
The 4hr has the potential right now of making a double bottom (one that leads to several hundred pips). If not, then there exists the possibility of it occuring on the Daily. However, there is a chance that a bounce might occur off the 61%/76% fibs or the lower pitchfork line before/if it is to occur.
Whenever you see two different sets of fib lines directly above/below each other, one will always be the duplicate of the other. The high and low for the range the original set is drawn on is usually indicated by the yellow arrows on the chart (sometimes I forget to include them). If they are not included, it should be easy to determine the range for the original set by just viewing the chart The 0%/100% fib line on one set should always conicide with the 100%/0% on the other at the high or low of the range (unless I have the fib lines drawn different for the purpose of showing an extension). If you see a closeup of a chart which doesn't show how the lines are drawn, you should be able to find the expanded chart in one of the more recent posts. Going forward, I will just post the expanded chart along with it. I was just trying to keep from posting too many charts.
Ignored
I just wanted to add that I always draw the original fib lines in blue and the duplicate in white.
When it comes to the fibs, it's no different than how you already use them. I just added more of them. Enter or exit a trade when price bounces off or has shown consistent support or resistance at one them. The pitchforks (trendlines) make trades that much better.
Ignored
What are "pitchfork" trendlines and how do you use them?
Are you using fibs to catch retracements of new highs or lows?
Do you look for convergences of the pitchforks and the fibs?
I understand that you are looking for consistent fib level bounces of a particular currency at one or two specific level, correct?
A. Finesse Williams
Making Millions One Pip At A Time!
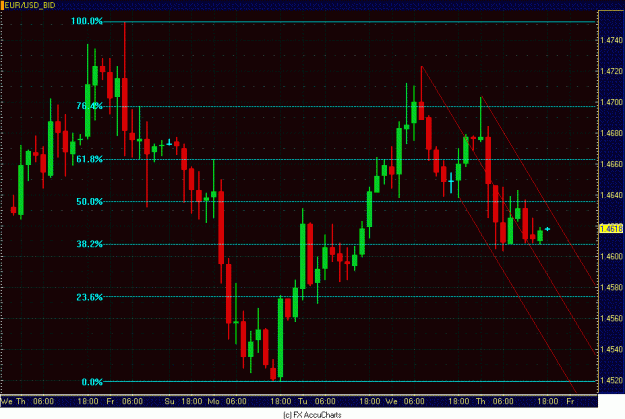
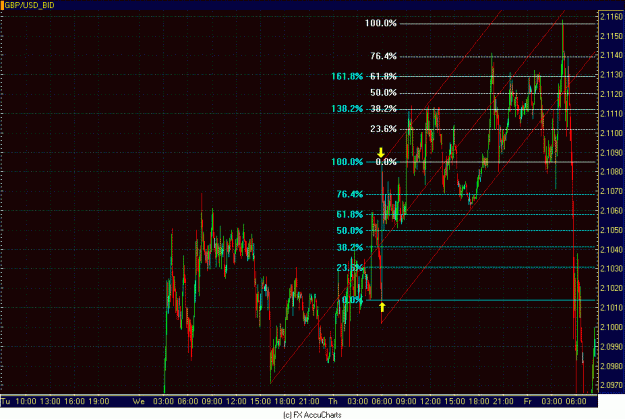
Here is an example. The fact that price did not remain inside of the pitchfork lines can be considered a bullish sign. Further confirmation was given when price refused to re-enter the pitchfork, candle closes above the fib line, and higher lows. Later, price started breaking through the wedge pattern with higher highs and lows. After fully breaking the wedge, price eventually broke through a fib line which served as resistance (you could have made some pips on the short side when price first arrived there). Price continued to push higher and made a top at the next fib line (where a short could have been taken).
So as you can see, there were many signs that pointed to price going higher. I hope this illustration was helpful.
Ignored
Ok I understand. But why do you add the extra fibs the way you do? It is a nice strategy. Can you use this method on any time frame or currency?
A. Finesse Williams
Making Millions One Pip At A Time!
Ok I understand. But why do you add the extra fibs the way you do? It is a nice strategy. Can you use this method on any time frame or currency?
Ignored
I learned to draw the fibs in the manner I do by just looking for creative ways to identify support and resistance levels. When I decided to try it this way I discovered that two of the normal extension levels (138 & 161) would always coincide with two of the fib levels in the duplicate set I placed above/below the original set. That's when I had the bright idea to just use all the secondary fib levels as extensions.
As far as timeframes, I have found that this method works best on the larger ones due to greater pip separation between fib levels but it can work on smaller frames as well. You will just have to try it out and see. A few consistent bounces off some of the fibs will validate the range you've chosen. Finding a proper range is the key to it all. If I draw fibs on a range (a small consolidation pattern for instance) where the fib level separation is very small, I would look to target the normal extension levels (138%, 161%, 261%) and/or a 100% move and possible reversal. Sometimes you can draw fibs on the high and low of just one candle (news candle for instance) if its range is larger than normal. I'll post some charts shortly to illustrate what I am saying.
(I included the the normal 138% and 161% extension levels on the original fibs to show how they coincide with the two fib lines in the duplicate set.)
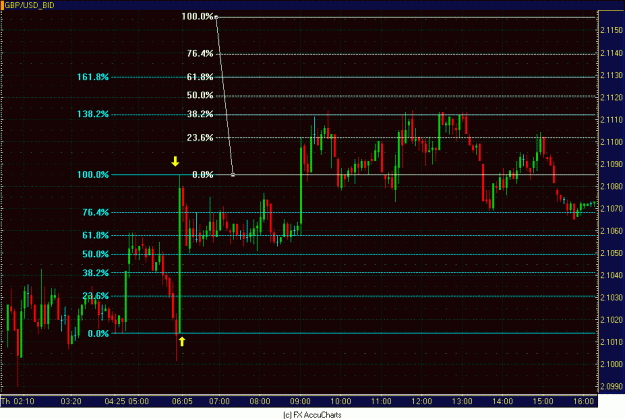
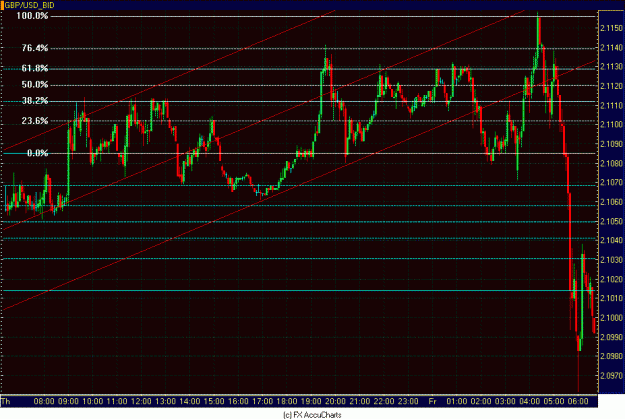
As you can see in the first chart, price spiked up at 6:00am. I drew fib lines on the high and low of the first 5 minute candle. I then made a duplicate of the fib levels and placed them atop the original fibs. The bottom of the duplicate set is placed at the high of the candle. As you can see, price hit certain fib levels and retraced/bounced.
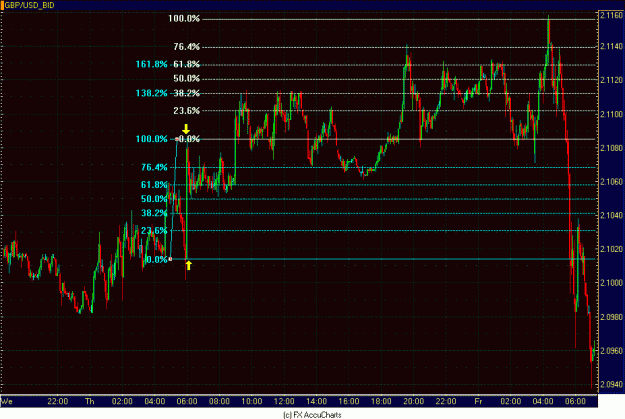
The second chart goes on to show how price reacted to the fib lines drawn just on that one candle. Price eventually went up and topped out at the100% leveland reversed back to the low of the candle the original fibs were drawn on, almost 24 hours later.
So, using the high of the candle as a starting point, price moved 300% in almost a 24 hour period. This is why I love using fibonacci lines. They allow you to gauge price movement, which is very important in the forex market.
What are "pitchfork" trendlines and how do you use them?
Are you using fibs to catch retracements of new highs or lows?
Do you look for convergences of the pitchforks and the fibs?
I understand that you are looking for consistent fib level bounces of a particular currency at one or two specific level, correct?
Ignored
Pitchforks (technically called Andrew's Pitchfork)are really just three trendlines that are automatically drawn using three significant high/low points on your charts. I have found that price responds quite well to them. Do a search here on FF for "pitchfork". There are some great threads discussing it. Here is one: http://www.forexfactory.com/showthread.php?t=9913
An entry/exit into a trade could be once price reaches a fib level, pitchfork line or the convergence of the two. A convergence is worthy to take note of, whether it is two fib lines or a fib line and pitchfork. I'm not saying that price will always bounce off a convergence. It just gives you an additional reason as to why it might occur. You also have to take certain factors into consideration such as price momentum and trend.
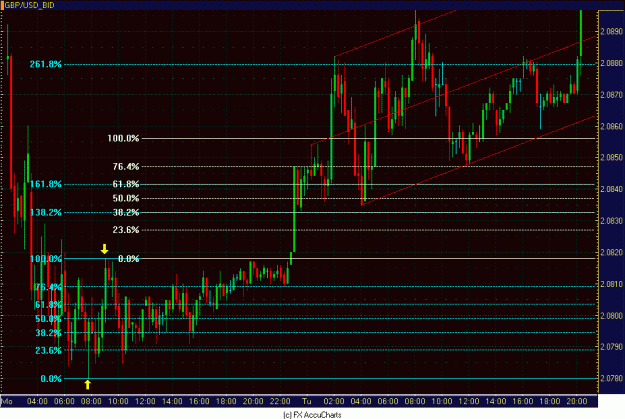
Here are charts of the earlier 5 minute Pound with a pitchfork thrown in the mix. I'm sure there are other pitchforks that could be added that would be helpful as well. I'm just using this one as an example. With pitchforks, you may sometimes end up using one or two points from an old pitchfork to draw a new one. If you've been following this thread this week you have seen some examples.
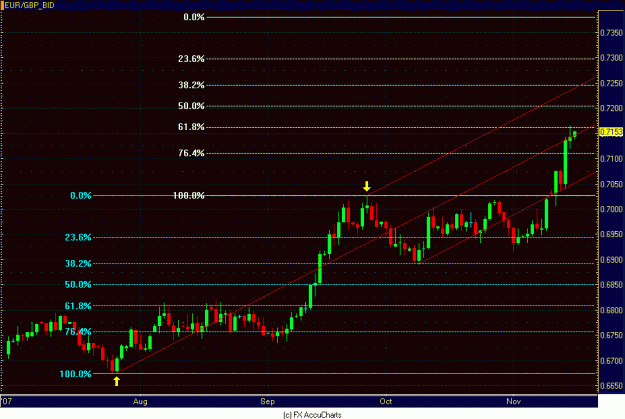
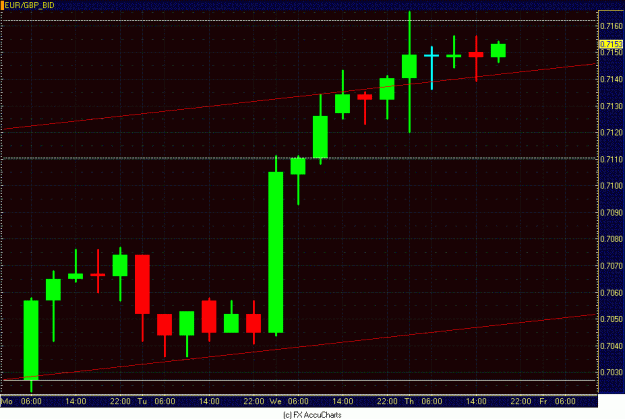
One of the best examples this week for the fibonacci and pitchfork combination was with EUR/GBP. That was truly beautiful.
Oh, and let's not forget the use of drawing regular old fashion trendlines/channel lines.