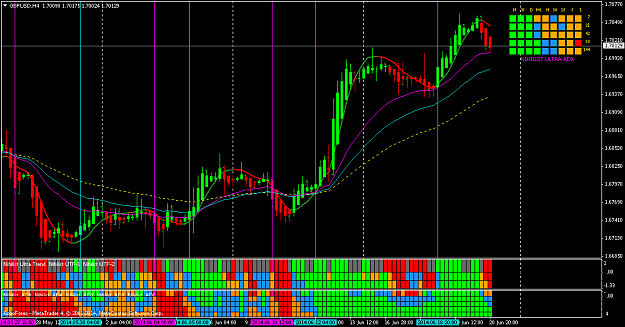
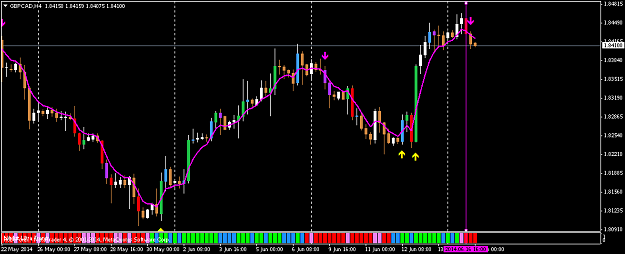
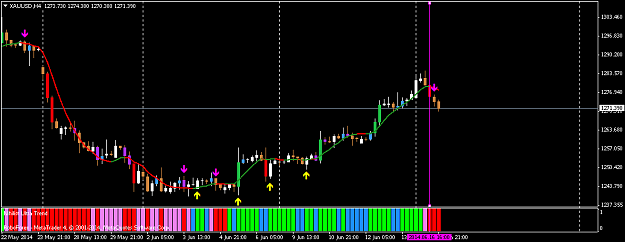
Hello FF mates, This is a higher time frame trading system (H4 to Weekly).
I made some indicators for this system. here we are using following indicators-
1.)Nihilist_Ultra_Trend_V2
2.)Nihilist_Trend_Filter_1
3.)Nihilist_Trend_Filter_2
4.)Nihilist_Ultra_ADX
5.)Nihilist_Ultra_ADX_Dash_mtf
Overview of the Systems
1.) Time Frame-H4/Daily/Weekly.
2.) Currency Pair/Metal-any.
3.) buy-
1st histogram (ultra trend)-- Lime.
2nd histogram (utf-1)- lime or dodgerblue
3rd histogram (utf-2)- lime or dodgerblue.
4.) Sell--
1st histogram (ultra trend)- Red.
2nd histogram (utf-1)- red or orange
3rd histogram (utf-2) - red or orange
5.) exit (buy/sell)
a.) after decent profit (it's up to you)
b.) run the trade until got the opposite signal.
c.) can be used weekly support/resistance.
d.) you can use trailing stop.
e.) or fixed TP- 50/100/150/200/ or more . (by reading the Higher tf like D1 & Weekly.)
6.)We have to care about the Weekly support/Resistance/Pivot Labels. and also psychological round labels also.
7.) SL- last swing high(for short trade)/ last swing low(for long trade).
8.) stay side line during the high impact news event .
You are requested to Demo trade first.
Wish you good luck.
- Nihilist
What is Nihilist_Ultra_ADX and How to Use it-
Nihilist ultra adx is a histogram type indicator which is derived from built in ADX of MT4.
if you use the template, you will find 5 row in a window with 4 color square blocks.
in 1st row - ADX of 7 period.
2nd row- ADX of 21 period.
3rd row- ADX of 42 period.
4th row- ADX of 89 period.
5th row- ADX of 144 period.
let us know the color legends-
Lime- adx is increasing with up trend ( active bullish movement)
DodgerBlue-adx is decreasing with up trend ( inactive bullish movement or slow bullish movement)
Red- adx is increasing with Down trend ( Active bearish movement)
DarkOrange - adx is decreasing with Down trend (inactive bearish movement or slow bearish movement)
How to use this set of ADXs-
if 5 rows in a column shows Lime color, then it is very active bullish movement.
if 5 rows in a column shows Red color, then it is very active bearish movement.
if every time frame (specially M5 to Weekly tf) shows Lime or Red then you can go for a 1st class trade with maximum lot size. This is very powerful indicator and it is never repaints after closing the candle.
( this is basically my Guru Mr. Alien's idea, you can know the details about the ADX behavior to visit the Alien's Extraterrestrial Visual Systems http://www.forexfactory.com/showthread.php?t=463573
Thank you all.Wish you good luck.
-Nihilist.
*** Multi pair Dashboard uploaded on http://www.forexfactory.com/showthre...30#post7555030
"Nihilist Holy Grail System" uploaded on http://www.forexfactory.com/showthre...28#post7593428
Attached File(s)
Every man who thinks ahead of his time is sure to be misunderstood.