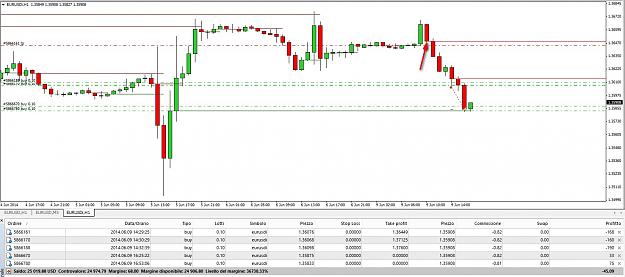
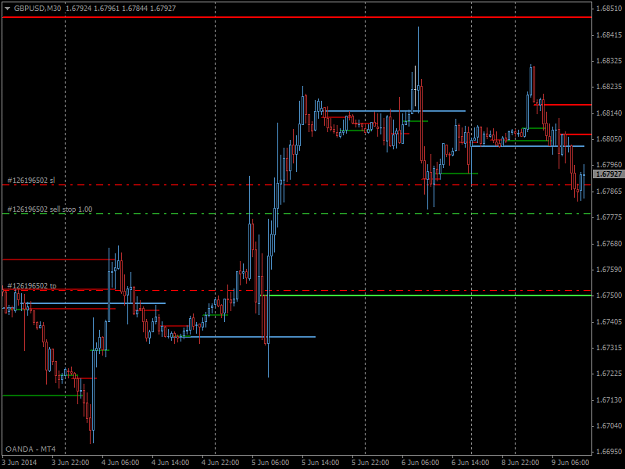
Well the lowest level was hit.
And the line got black at opening of the following candle.
No more lower levels for now given by the indi, even if in my concept there would be a next one at around 1.3479
So I opened a long trade (2 actually very near) at the touch of the level....
The next upper level of 1.3613 seem to me a bit "too forced" to be correct, but on the way up to 1.3648 (clearer to my for the "logic" of the concept) it would be hit anyway...
No Idea of "When", but let's see....
Still trying to understand what I do and why
But I keep walking....
{quote} Well the lowest level was hit. And the line got black at opening of the following candle. No more lower levels for now given by the indi, even if in my concept there would be a next one at around 1.3479 So I opened a long trade (2 actually very near) at the touch of the level.... The next upper level of 1.3613 seem to me a bit "too forced" to be correct, but on the way up to 1.3648 (clearer to my for the "logic" of the concept) it would be hit anyway... No Idea of "When", but let's see.... Still trying to understand what I do and why ...
Ignored
Hi everyone,
Same as you Whenever. See attached
Open two long positions too with different take profit levels. Will see how it will reach these levels
Quoting shiva (http://www.forexfactory.com/showthread.php?p=7386260#post7386260)
Some people here said "Many people can predict where price will go but not when" EurUsdd has already answered that - "Before the bar leaves your screen" Should be obviousIf its a 4 hr chart he forecasting the price to reach a given level in 4 hours
Thank you. At least there is still hope for the world. Now everyone is lost.
ut the underlined statement is not exactly true. Before the BAR leaves your screen, price should hit the target. Your chart shifts every time there is a new bar. so, before the target bar leaves your screen, price should hit the target
Two options: UP or DOWN!!! That should be EASY.
Quoting Nidolap (http://www.forexfactory.com/showthread.php?p=7386527#post7386527)
{quote} Well, count me in. I am not a full time trader also but with those withdraws values you showed us I don't see why I shouldn't be.
You are welcomed! When we decide that a price level is reachable (most within 24 hrs, before the bar leaves your screen), I will be glad to hear from you how the level fits into your plans too. We are all traders and you must have your own plans. I am not going to dictate to you to throw your price targets away for mine. But you will realize with time that my levels are reliable.
Your contribution will be valuable if you focus on helping other critique - constructively - the levels we post here.
Thank you and more pips to you.
Quoting Wflori (http://www.forexfactory.com/showthread.php?p=7386690#post7386690)
Hello, I read your topic and it is interesting, especially since I have a similar strategy from what I saw in your pictures. But the problem in my strategy which is on a post-it on my wall (and not running live beacause of the following problem) is the drawdown, and I think you have the same problem, when I look at your pictures. You know where the price will be, but not knowing when makes you having a certain drawdown on your account until the trade finishes. So how do you manage these drawdowns ?
There is no problem with this approach. When an orange/yellow arrow appears on a bar, price should return to the top/bottom of the bar before the bar completely leaves your screen. So all you have to do is enter anywhere and wait for the correction. Now on the 1hr chart, 50-100pips is a good place to enter.
Last post is about pips and distance as eurusdd said .
first posts are for timing .also is eurusdd posts. at early pages
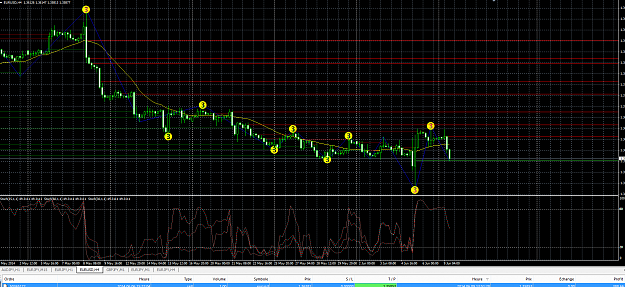
Looking at the USDCAD 4H with an RSI(14) it seems that when a candle forms during a drop in the RSI, it has a fairly high probability of being engulfed by subsequent candles in a fairly short time (within one chart page as Eurusdd claims). Of course the open/close is engulfed more often than the high/low. So conservative traders would use open/close versus high/low for more aggressive traders. Just a thought as to the basis of his indi.
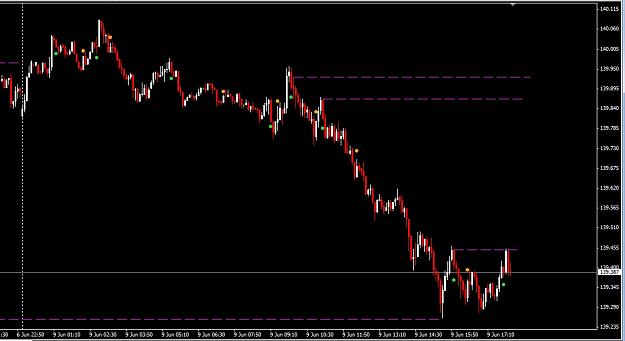
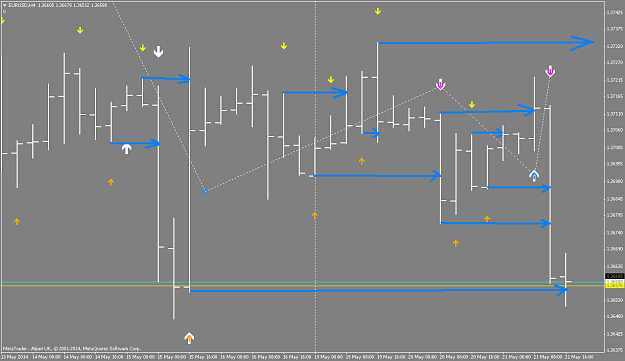
EURJPY 5-min chart. Level hit, no other confirming timeframe. These levels that are within the high/low for the day are interesting scalps. Carl {image}
Ignored
You're going for the high of the bar with the green dot and low of the bar with orange dot. Using same dots, Old Dog is going for reverse
{quote} You're going for the high of the bar with the green dot and low of the bar with orange dot. Using same dots, Old Dog is going for reverse http://www.forexfactory.com/showthread.php?p=7514577#post7514577 ???
Ignored
Yes, I am.
If you look at OD's first chart, he has signal price levels that go THROUGH 2, 3 and 4 bars and that price level.
Sorry, that does not make sense to me. So, that target price goes through the next few bars??? Seems arbitrary to me.
I'm not saying he is wrong, it is just that I don't understand when you know price has retraced back to that level, the way he is doing it.
The way I'm doing it (my opinion), my signal price target is NEVER touched by any part of any bar. If is does, its done.
{quote} Yes, I am. If you look at OD's first chart, he has signal price levels that go THROUGH 2, 3 and 4 bars and that price level. Sorry, that does not make sense to me. So, that target price goes through the next few bars??? Seems arbitrary to me. I'm not saying he is wrong, it is just that I don't understand when you know price has retraced back to that level, the way he is doing it. The way I'm doing it (my opinion), my signal price target is NEVER touched by any part of any bar. If is does, its done. Example from OD's post below. Carl {image}...
Ignored
Hey Carl, you are right. Or I understand it as well as you. Why would be that level still valid if a price already was there, it doesn´t make any sense to me.