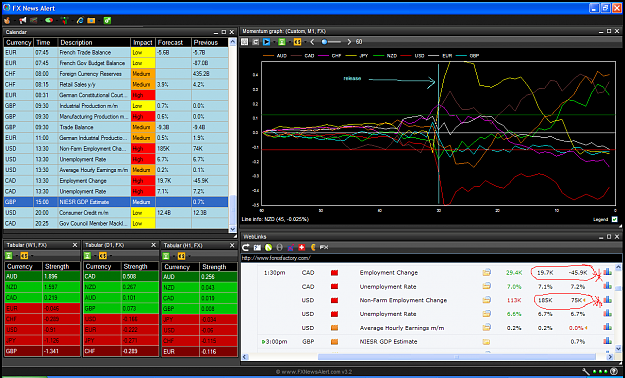
I want to document price action 30mins after a major cluster of high impact events are released, to provide an historical sentiment before and after.
I'll use my calendar widget (top left) to identify high impact events that occur at the same time and take a screenshot of my dashboard 30min after the release and then use the last 60 candles of 1min momentum (top-right) to show sentiment for base/quote currencies before and after the events. I'll also identify any major difference(s) on the forecast and previous calendar numbers (bottom right).
Caveat: This is not a signal service, but a journal of sorts to build a picture of how currencies move on these volatile days for later analysis.
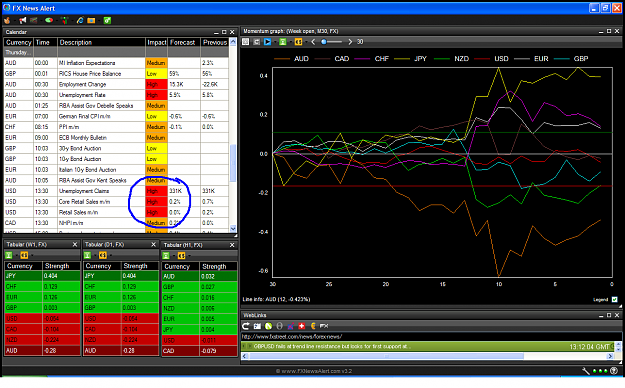
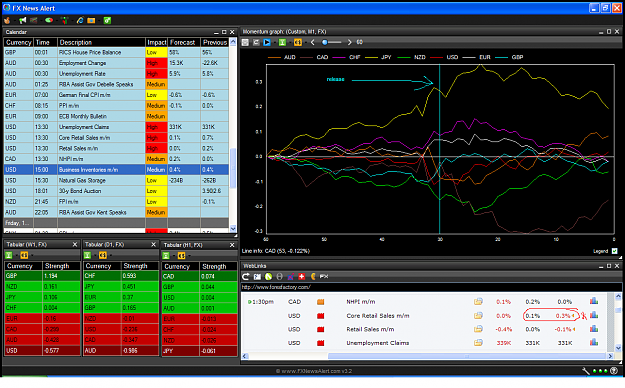
Politics is the womb in which war develops.