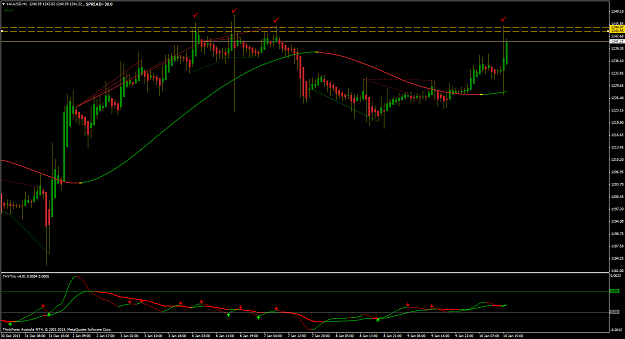
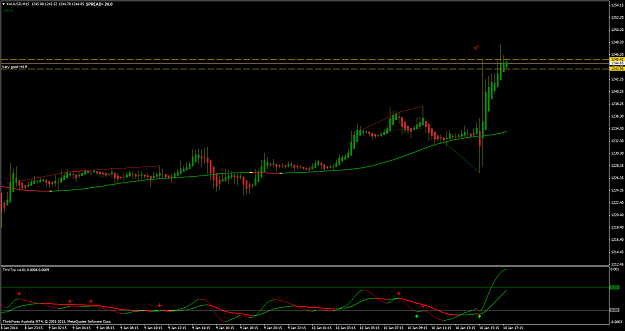
Disliked{quote} Hello Kirk, I have attached a chart to illustrate what seems to be going on here....it looks like a head and shoulders bottom is trying to appear on gold right now. Do you see the arcs on the bottom? i use those to illustrate the left shoulder, head and right shoulder. The idea is this...sellers pushed price down to the left shoulder, buyers then came in and bought it up to resistance, and then more sellers came in and took it even lower before buyers came in and again took it up to that same area of resistance. (1231 area) Finally, more...Ignored
- | Additional Username | Joined Mar 2012 | 2,539 Posts
When the Joker is in the deck.. fear not and play it well