Hello guys / girls,
did anybody of you know a tool / indicator / script or whatever which draw my signals from Macd and Osma in a other timezone?
For example im using the Daily chart with the daily osma and macd. But im trading the H1 chart and want to see the signals from the daily macd and osma in my H1 chart. Its very stressful to draw it all manually and i lose lot time when i do it with 6 Pairs. My Strategie is based on Daily H4 H1 M30 and M15 Macd and Osma Signals and to draw it all manually its to hard for me. If there is a tool i would be very happy. If there is none, maybe one of you can code this? If you wanna money for it maybe i can give a bit in paysafe or if you want something other say it me here in thread or private.
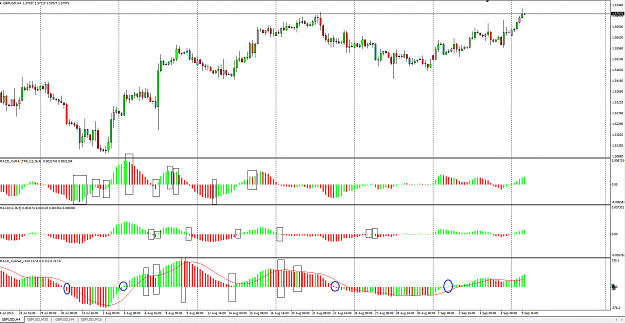
Screen number one: "options"
here are all the signals i need. they are in the screen too.
Color change: MACD
upper half from green to red
upper half from red to green
lower half from green to red
lower half from red to green
zero crossing line: MACD
crossing from bottom to top
crossing from top to bottom
signal line crossing: MACD
upper half - cross under signal line
upper half - cross over signal line
lower half - cross under signal line
lower half - cross over signal line
Color change: OSMA
upper half from green to red
upper half from red to green
lower half from green to red
lower half from red to green
zero crossing line: Osma
crossing from bottom to top
crossing from top to bottom
it sound very lot signals but they are just all we know. the screen is showing all signals too.
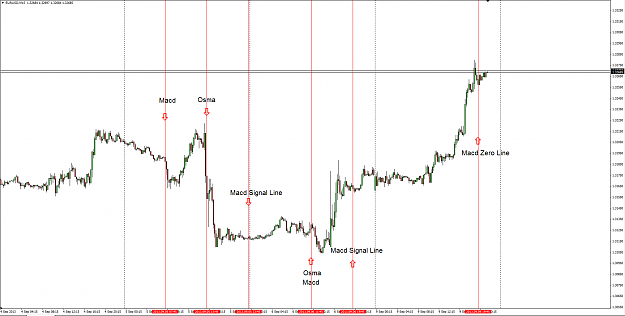
Screen 2: "3434"
here is a screen how i want to have the signals in the shart. its just a example but impotant for me is the text "Macd", "Osma", Macd Signal line and so on AND the arrow with shows the movement.
It would be very lovely when i can put more signals from more timeframes in one Chart. For examples the signals from Daily and H4 into the M15 Chart. I hope this task is not difficult and if someone want a reward for this job just tell it me.
with king regards
paruski
*if there are questions just ask
did anybody of you know a tool / indicator / script or whatever which draw my signals from Macd and Osma in a other timezone?
For example im using the Daily chart with the daily osma and macd. But im trading the H1 chart and want to see the signals from the daily macd and osma in my H1 chart. Its very stressful to draw it all manually and i lose lot time when i do it with 6 Pairs. My Strategie is based on Daily H4 H1 M30 and M15 Macd and Osma Signals and to draw it all manually its to hard for me. If there is a tool i would be very happy. If there is none, maybe one of you can code this? If you wanna money for it maybe i can give a bit in paysafe or if you want something other say it me here in thread or private.
Screen number one: "options"
here are all the signals i need. they are in the screen too.
Color change: MACD
upper half from green to red
upper half from red to green
lower half from green to red
lower half from red to green
zero crossing line: MACD
crossing from bottom to top
crossing from top to bottom
signal line crossing: MACD
upper half - cross under signal line
upper half - cross over signal line
lower half - cross under signal line
lower half - cross over signal line
Color change: OSMA
upper half from green to red
upper half from red to green
lower half from green to red
lower half from red to green
zero crossing line: Osma
crossing from bottom to top
crossing from top to bottom
it sound very lot signals but they are just all we know. the screen is showing all signals too.
Screen 2: "3434"
here is a screen how i want to have the signals in the shart. its just a example but impotant for me is the text "Macd", "Osma", Macd Signal line and so on AND the arrow with shows the movement.
It would be very lovely when i can put more signals from more timeframes in one Chart. For examples the signals from Daily and H4 into the M15 Chart. I hope this task is not difficult and if someone want a reward for this job just tell it me.
with king regards
paruski
*if there are questions just ask
Attached Image(s) (click to enlarge)