• Home
  • Forums
  • Trades
  • News
  • Calendar
  • Market
  • Brokers
  • Login
  • Join
  • 11:20pm
Menu
  • Forums
  • Trades
  • News
  • Calendar
  • Market
  • Brokers
  • Login
  • Join
  • 11:20pm
Sister Sites
  • Metals Mine
  • Energy EXCH
  • Crypto Craft

Options

Bookmark Thread

First Page First Unread Last Page Last Post

Print Thread

Similar Threads

Are you a trend trader or a counter-trend trader? 29 replies

from retail trader to full-time trader 17 replies

Discipline Trader and Voice Trader EA/IND 16 replies

Infiniti ea - test going well so far! 9 replies

IkonFX Viking Trader or Pfgbest Viking Trader? 2 replies

  • Trading Journals
  • /
  • Reply to Thread
  • Subscribe
  • 24
Attachments: Infiniti Trader
Exit Attachments
Tags: Infiniti Trader
Cancel

Infiniti Trader

  • Last Post
  •  
  • Page 1 2
  • Page 1 2
  •  
  • Post #1
  • Quote
  • First Post: Jul 5, 2013 11:24am Jul 5, 2013 11:24am
  •  trader1024
  • | Joined May 2007 | Status: Market Profiler | 68 Posts
Hi,
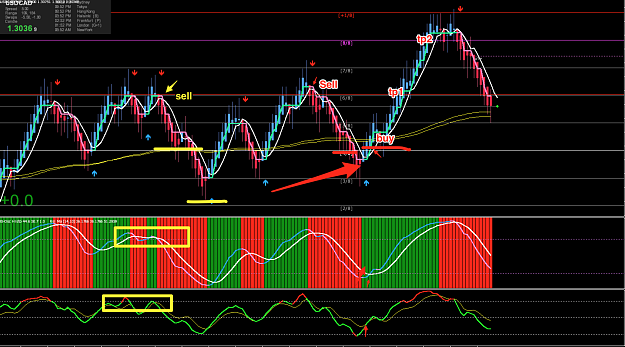
Purpose of the Thread is to keep a Journal and reasoning behind the taking the trades. I mainly trade GBP/JPY on the higher TF. More to come and to the infinity and beyond...
  • Post #2
  • Quote
  • Jul 5, 2013 11:32am Jul 5, 2013 11:32am
  •  trader1024
  • | Joined May 2007 | Status: Market Profiler | 68 Posts
First Trade : GBP/JPY Buy Zone @ 150 TP 153.21 153.90
Attached Image (click to enlarge)
Click to Enlarge

Name: 05072013.png
Size: 53 KB
 
 
  • Post #3
  • Quote
  • Jul 6, 2013 1:55am Jul 6, 2013 1:55am
  •  trader1024
  • | Joined May 2007 | Status: Market Profiler | 68 Posts
Daily Update on the Trade : GBP/JPY closed as a PINBar testing the TrendLine. Next Week should see upside to test the upper end of the trendline and the resistance cluster at around 153.21 to 154.68 (Murrey Math Lines) . Support of 149.60. Next week would likely test 150 area again.
 
 
  • Post #4
  • Quote
  • Jul 10, 2013 11:45am Jul 10, 2013 11:45am
  •  trader1024
  • | Joined May 2007 | Status: Market Profiler | 68 Posts
Close trade at 151.56 as resistance
 
 
  • Post #5
  • Quote
  • Jul 13, 2013 1:49am Jul 13, 2013 1:49am
  •  trader1024
  • | Joined May 2007 | Status: Market Profiler | 68 Posts
GBP/NZD : Right on the TrendLine , Resistance zone of 1.9400.
Attached Image (click to enlarge)
Click to Enlarge

Name: GBPNZD_H4_13072013.png
Size: 72 KB
 
 
  • Post #6
  • Quote
  • Aug 28, 2014 6:01am Aug 28, 2014 6:01am
  •  trader1024
  • | Joined May 2007 | Status: Market Profiler | 68 Posts
Trade Diary : H4
GBP/JPY :
QQE : Sell
TCCI : Sell
HiLo Gann H4 : sell
Sell Signal @ 172.30
 
 
  • Post #7
  • Quote
  • Aug 30, 2014 10:15am Aug 30, 2014 10:15am
  •  trader1024
  • | Joined May 2007 | Status: Market Profiler | 68 Posts
29/08/2014 : Closed Short Trades at +10
GBP/JPY :
QQE : Buy
TCCI : Buy
HiLo Gann H4 : BUY
Buy Signal @ 172.18

TP1 : 172.84
TP2 : 173.60
TP3 : TCCI change color
Attached Image (click to enlarge)
Click to Enlarge

Name: Screenshot1.png
Size: 233 KB
 
 
  • Post #8
  • Quote
  • Sep 2, 2014 9:46am Sep 2, 2014 9:46am
  •  trader1024
  • | Joined May 2007 | Status: Market Profiler | 68 Posts
Closed all Trades at 173.50
Waiting for next trade
 
 
  • Post #9
  • Quote
  • Sep 4, 2014 3:16pm Sep 4, 2014 3:16pm
  •  trader1024
  • | Joined May 2007 | Status: Market Profiler | 68 Posts
Attached Image (click to enlarge)
Click to Enlarge

Name: GBPJPY_H4.png
Size: 321 KB

Sell at 173.32
TP1 : 172.85
TP2 : 172.06
TP3 :
 
 
  • Post #10
  • Quote
  • Sep 4, 2014 3:34pm Sep 4, 2014 3:34pm
  •  trader1024
  • | Joined May 2007 | Status: Market Profiler | 68 Posts
Attached Image (click to enlarge)
Click to Enlarge

Name: eurusd_monthly.png
Size: 1.2 MB

TP1 : 1.20
Expecting break of 1.20
 
 
  • Post #11
  • Quote
  • Sep 4, 2014 3:48pm Sep 4, 2014 3:48pm
  •  trader1024
  • | Joined May 2007 | Status: Market Profiler | 68 Posts
Trading system :
TimeFrame : h4

TCCI : 13
Gann HiLo 10
RSX /QQE

Buy :
TCCI turns green , Gann HiLo Flips : QQE at closing in on a buy
RSX turns up from oversold or from 50 levels

Sell :


TCCI turns Red, Gann HiLo Flips : QQE at closing in on a sell
RSX turns down from overbought 80 or from 50 levels

TP1 ,TP2
 
 
  • Post #12
  • Quote
  • Sep 14, 2014 10:52pm Sep 14, 2014 10:52pm
  •  trader1024
  • | Joined May 2007 | Status: Market Profiler | 68 Posts
Attached Image (click to enlarge)
Click to Enlarge

Name: gpy_h4.png
Size: 280 KB
 
 
  • Post #13
  • Quote
  • Sep 17, 2014 12:19am Sep 17, 2014 12:19am
  •  trader1024
  • | Joined May 2007 | Status: Market Profiler | 68 Posts
Buy GPY/JPY based on price reaction(pin/hammer formed bar) from 34ema tunnel , TCCI turns green and hilo flip
TP1 : 175.39
Attached Image (click to enlarge)
Click to Enlarge

Name: gbpjpy_buy_h4_16092014.png
Size: 215 KB
 
 
  • Post #14
  • Quote
  • Mar 13, 2015 6:31am Mar 13, 2015 6:31am
  •  trader1024
  • | Joined May 2007 | Status: Market Profiler | 68 Posts
Position : SELL
Price between 5/8180.66) and 4/8(180.27) MML . Broken thro the lines and broke thro 180 .
Attached Image (click to enlarge)
Click to Enlarge

Name: Screen Shot 2015-03-13 at 2.26.16 PM.png
Size: 1.5 MB
 
 
  • Post #15
  • Quote
  • Mar 21, 2015 1:28am Mar 21, 2015 1:28am
  •  trader1024
  • | Joined May 2007 | Status: Market Profiler | 68 Posts
USD/JPY : Trade : Sell
HMA : Red
Bearish Pattern
Closed Below 12ema (low)
Break from the TrendLine
Attached Image (click to enlarge)
Click to Enlarge

Name: usdjpy_20032015.png
Size: 218 KB
 
 
  • Post #16
  • Quote
  • Apr 25, 2015 3:18am Apr 25, 2015 3:18am
  •  trader1024
  • | Joined May 2007 | Status: Market Profiler | 68 Posts
Trend : identified by 18 & 28 ema and 50 & 60 ema .
Trend Change : bar closing above or below the ema .
Attached Image (click to enlarge)
Click to Enlarge

Name: usdjpy_trades.png
Size: 452 KB
 
 
  • Post #17
  • Quote
  • Aug 16, 2015 2:09am Aug 16, 2015 2:09am
  •  trader1024
  • | Joined May 2007 | Status: Market Profiler | 68 Posts
My Journey to 1$ Million USD and more

1). Always stick to the rules defined
2). Collect Pips
3). Follow rules and Stick to
 
 
  • Post #18
  • Quote
  • Jan 10, 2016 2:19am Jan 10, 2016 2:19am
  •  trader1024
  • | Joined May 2007 | Status: Market Profiler | 68 Posts
Rules :

Sell
1). Close below HMA , ( Closes below the tunnel ) and RSIONMA Bearish (Crosses down )
Profit taking 15 pips above each MML Line

Buy
1). Close above HMA , ( Closes above the tunnel ) and RSIONMA Bullish (Crosses up )
Profit taking 15 pips below each MML Line
Attached Image (click to enlarge)
Click to Enlarge

Name: GBPJPY_10012016.png
Size: 158 KB
 
 
  • Post #19
  • Quote
  • May 1, 2016 1:15am May 1, 2016 1:15am
  •  trader1024
  • | Joined May 2007 | Status: Market Profiler | 68 Posts
OverAll Market Direction & Trend : Tunnel 30 sma
minor s/r : 12 sma
When Price is above the Tunnel
1). Buy : (Price in direction of main Trend)
When HA turns Blue
Also look at TDI not to be oversold area near 68 line Esp the Yellow Line
First TP (04/0.5): 40 pips
Second TP : Change of HA Color to Red

2). Sell : (Short Term Correction ) Against the Main Trend
When HA turns RED
First TP (0.75) : 30 pips
Second TP (0.25) : Change of HA color to Blue


When Price is below the Tunnel
1). Sell : (Price in direction of main Trend)
When HA turns Red
Also look at TDI not to be oversold area near the 32 line Esp the Yellow Line
First TP (04/0.5): 40 pips
Second TP : Change of HA Color to Blue

2). Buy : (Short Term Correction ) Against the Main Trend
When HA turns Blue
First TP (0.75) : 30 pips
Second TP (0.25) : Change of HA color to RED
Attached Image (click to enlarge)
Click to Enlarge

Name: GBPJPY_InfinitySystem_20160501.png
Size: 110 KB
 
 
  • Post #20
  • Quote
  • Jul 31, 2016 9:10am Jul 31, 2016 9:10am
  •  trader1024
  • | Joined May 2007 | Status: Market Profiler | 68 Posts
BUY

1). TMS is GREEN
2). Price closed above the 10 LWMA and half trend
3). Both Osc turning up and ideally oversold area unless a huge trend

SELL

1). TMS is RED
2). Price closed below the 10 LWMA and half trend
3). Both Osc turning down and ideally overbought area unless a huge trend


TP and SL

TP : every 2 MML and last lot after reverse signal
SL : Below the swing low or bottom of the trigger bar.
Attached Image (click to enlarge)
Click to Enlarge

Name: Screenshot3.png
Size: 289 KB
 
 
  • Trading Journals
  • /
  • Infiniti Trader
  • Reply to Thread
    • Page 1 2
    • Page 1 2
0 traders viewing now
  • More
Top of Page
  • Facebook
  • Twitter
About FF
  • Mission
  • Products
  • User Guide
  • Media Kit
  • Blog
  • Contact
FF Products
  • Forums
  • Trades
  • Calendar
  • News
  • Market
  • Brokers
  • Trade Explorer
FF Website
  • Homepage
  • Search
  • Members
  • Report a Bug
Follow FF
  • Facebook
  • Twitter

FF Sister Sites:

  • Metals Mine
  • Energy EXCH
  • Crypto Craft

Forex Factory® is a brand of Fair Economy, Inc.

Terms of Service / ©2023