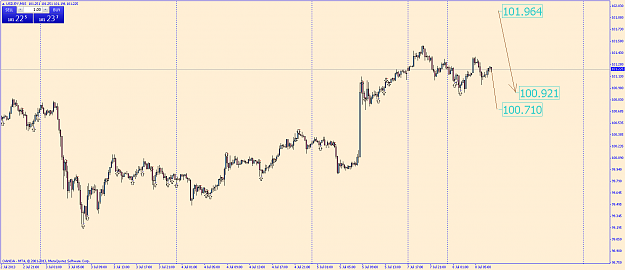
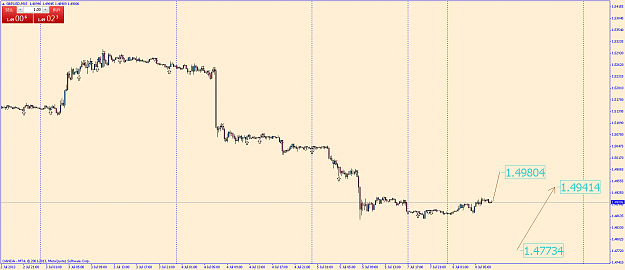
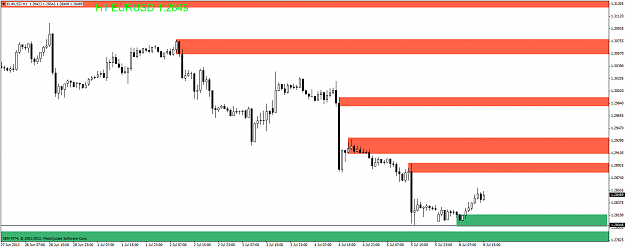
I also think a stop run below 1.48 is coming soon with a small shakeout afterwards. FOMC minutes and Big Ben on Wednesday are the obvious candidates to trigger a resumption of the downtrend.
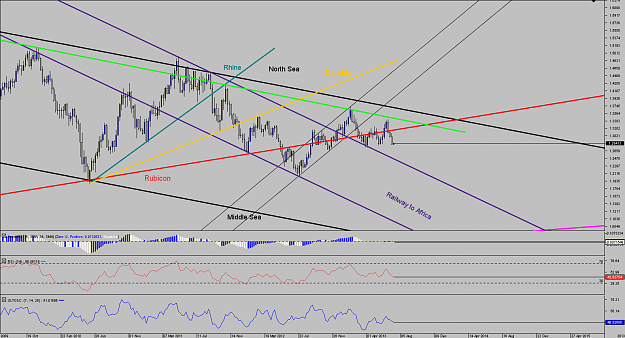
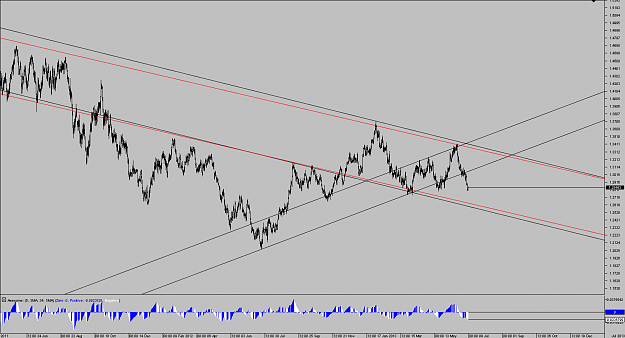
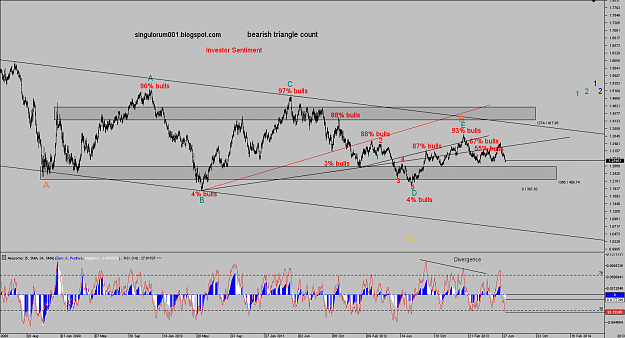
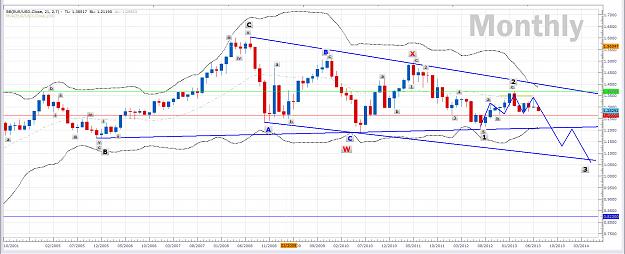
Hey infinitus here is my look at longer term Monthly chart. Your C to D wave looks a little more impulsive than corrective. I believe in triangles each wave should be ABC, right? C to D looks more like 5 waves to me. Just a thought. Here is my chart for what it is worth.
{quote} Hey infinitus here is my look at longer term Monthly chart. Your C to D wave looks a little more impulsive than corrective. I believe in triangles each wave should be ABC, right? C to D looks more like 5 waves to me. Just a thought. Here is my chart for what it is worth. {image}
Ignored
Hi MIG,
long time no see no hear - hope all is well.
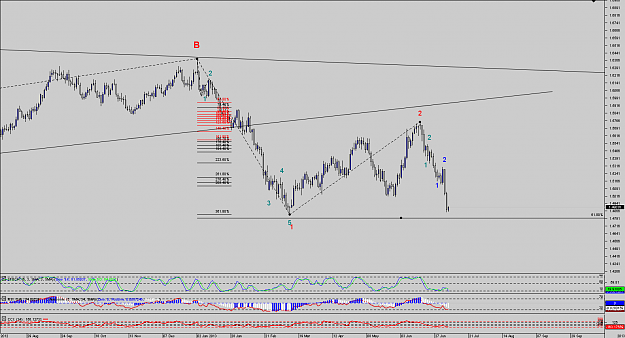
Sadly, the whole count from the very top on is very debatable. This cat can be skinned in many ways. If you ask me - the more bearish the better LOL
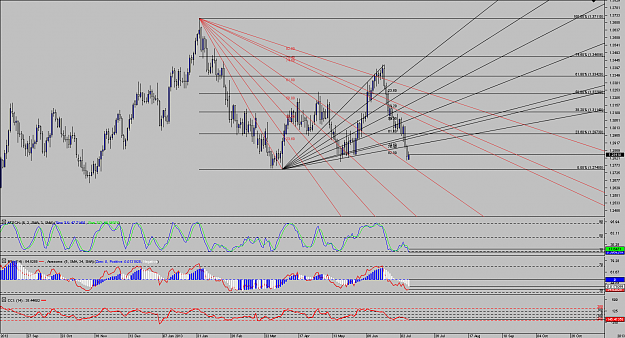
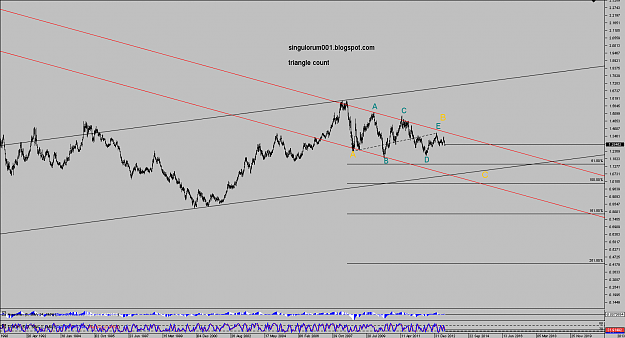
One of my alternatives looks like your count. Especially the structure of the wave D (in my main count) was in the past debated all over. I found it very hard to count a clear impulse on different TF's, because you run frequently into overlapping waves.
We will see.......
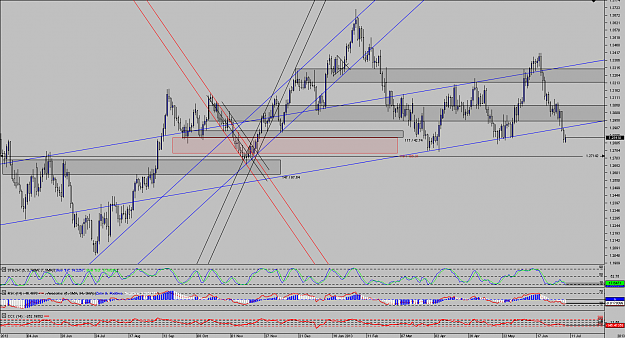
I only seldomly count on monthly scale because of too much of loss of information. Even weekly can be dangerous....