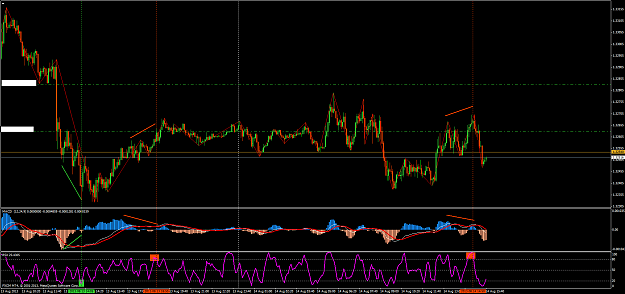
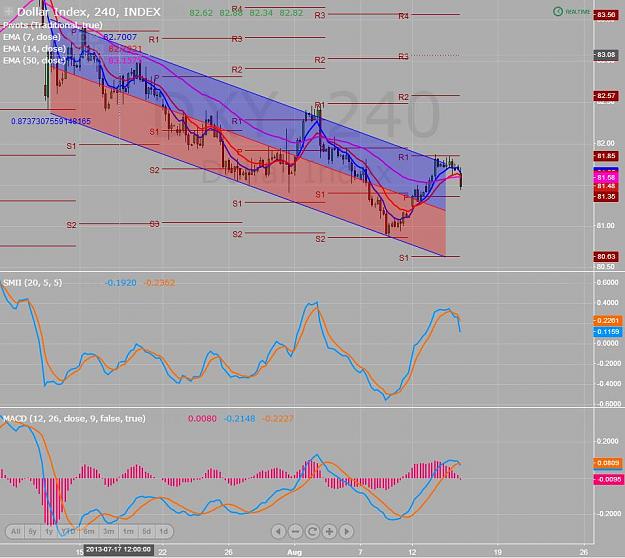
Disliked{quote} Hello, learning this item. As I've in my H4 chart, I could identify, another demand areas at 31.85 and at 31.65. ¿what do you do to create the ``area''? I can identify the lows in the H4 candles, before a big movement upside we had before. ¿do you add +5 and -5? ¿do you consider the open of that H4 candel?? Today short from 32.75 to 32.44. +31 pips. 75 was a h1 kijun (resistance) and 44 was a Bollinger in H1. I've got in Ichimoku system a big resistance at 30.86 (weekly kijun and daily cloud) , that I can see is another demand area.Ignored
On small time frames, I prefer daily pivot, R, S and mid pivot lines in confluence with trend lines and channels.
Those who say it cannot be done should not interrupt those who are doing it