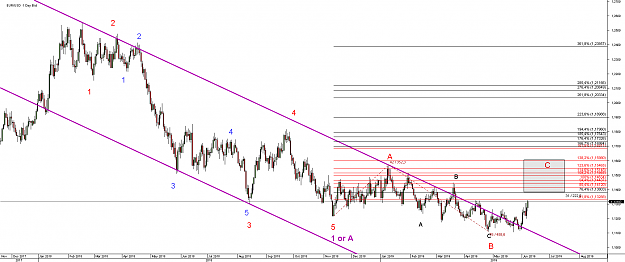
DislikedEURUSD: Did Rich Swannell or any other Elliott Guru some searches with "Ending Diagonals" ? Can such an ED finished with a "failure" pattern also ? It looks actually so ... Sixer {image}Ignored
the black 1 to 5 may represent the ending or leading diagonal approach. In this case we might be in wave B up of wave 5 ABC
Attached Image (click to enlarge)
I found this in a document regarding EW
Diagonal Triangle
Regeln:
Wellen bewegen sich zwischen zwei Diagonalen.
Welle 1 = LD oder IM
Welle 2 = Jede Korrektur außer Triangle
Welle 2 = nicht länger als Welle 1
Welle 3 = größer als Welle 2 Preislich
Welle 4 = kann jedes Korrekturpattern sein
Welle 2 und Welle 4 müssen sich überlappen
Wave 5 hat mindestens 50% von Welle 4
Welle 3 ist nicht die kürzeste verglichen mit Wave 1 und Wave 5
Bei einer ED:
Welle 1,3,5 = alle ZigZag
Bei einer LD:
Welle 3 = IM
Wave 5 = IM oder ED
Länge der Wellen im Vergleich zur Welle 1 Charts (Preis/Zeit):
Welle
Kurzf. Preis
Kurzf. Zeit
Langf. Preis
Langf. Zeit
II
40%-85%
40% - 150%
42% - 80%
20% - 50%
III
70%-130%
40% - 150%
60% - 130%
20% - 60%
IV
22% - 60%
-
20% - 50%
-
V
35% - 90%
20% - 80%
40% - 85%
10% - 30%
Basically it states, that wave 5 has to be at least 50% of wave 4 - that would mean truncation. But whe one reads the Swannell Data, there was not enough data /no data to show that. I only found, that on average note wave 5 is around 156% of wave 4
When looking at wave 3 wave 5 relationship, you have a good case when wave 5 is 40-80% of wave 3
Prechter stated the following:
The Elliott Wave rules governing Diagonals are as follows:
• Diagonals move within two converging channel lines.
• Wave 1 of a Leading Diagonal is an Impulse or a Leading
Diagonal.
• Waves 1, 3 and 5 of an Ending Diagonal are always a Zigzag
family pattern.
• Wave 2 may be any corrective pattern except a Triangle.
• Wave 2 is never longer than Wave 1 by price.
• Wave 3 of a Leading Diagonal is an Impulse.
• Wave 3 is always greater than Wave 2 by price.
• Wave 4 may be any corrective pattern.
• Waves 2 and 4 must share some common price territory
(must overlap).
• Wave 5 of a Leading Diagonal is either an Impulse or Ending
Diagonal.
• Wave 5 must be at least 50% of Wave 4 by price.
• Wave 3 must not be shortest by price when compared with
Waves 1 and 5.
BTW: I have seen Leading Diagonals, where wave 1 and wave 3 were best counted as zigzag - but that was in Forex, where pattern might not be as clear as in Stocks
Also interesting is this from Prechter on a generally note:
1. Wave three is most often the extended wave.
2. Peak acceleration occurs at the structural center of each wave, i.e. in wave 3 of 3 of 3.
3. In the stock market, fifth waves are always weaker than third waves.
4. B waves of contracting triangles often reach a new price extreme.
5. Even so, E waves of triangles in the wave four position always end within the territory of the preceding third wave.
6. Double flats are somewhere between rare and non-existent; I’ve seen flat-X-triangle serve as double three.
7. The barrier triangle is a more useful idea than the idea of independent ascending and descending triangles.
8. Zigzags often adhere to channels.
9. In zigzags, A waves tend to be steeper than C waves.
10. In flats, C waves tend to be steeper than A waves.
This is also important from Prechter, when he was interviewd:
3a. We have analyzed thousands of charts on multiple timeframes and have found a few rules and/or guidelines that MAY be a bit too strict. For example, the rule that states "Waves 1, 2, 3, 4 and 5 of an ending diagonal always subdivide into zigzags" seems to be a bit too stringent as a hard rule, as we believe we have found examples when an Ending Diagonal does not subdivide in this manner. So, are there any plans to update any of the rules within the standard EW structure now that we have decades of further real world example of chart patterns?
An Elliott wave group in Russia asked if diagonals can occasionally have a third wave longer than wave one. The answer is pretty much the same:
I believe it likely that strict rules apply to the inferred Elliott waves of shared mood. But there are no categorical imperatives pertaining to records of the actions people take to express their moods. Market prices are imperfect reflections of market mood, because they record only people's actions. Waves at small degrees -- intraday -- are especially imperfect because some individual trading actions can be either forced or impeded by circumstances. Until we can probe people's brains to record waves of social mood directly, we are stuck with this imperfection. If you read the paragraph on page 86 of Elliott Wave Principle titled "A Summary of Rules and Guidelines for Waves," you can see that I explicitly stated this point in the book.
Figure 1-18 in that book, which was published in 1978, shows a long third wave in a contracting diagonal, and waves two and four don't even overlap. I decided as soon as it ended that a diagonal was the best count, since the subdivisions were three waves, the shape was a wedge, and it was the fifth wave of a decline. Sure enough, the market reversed after it was over.
Until we have a statistical answer to the question of when to allow this or that variation, the best answer is a practical one, and here is mine: The only time an analyst should allow an imperfection in a wave is retrospectively when all other aspects of the wave demand it. Suppose you see a wedge-shaped fifth wave with 4-1 overlap and three-wave subdivisions, but wave 3 is longer than wave 1, or one of the waves subdivides into a five. If your next alternative is even less compatible with the model, then label the wave a diagonal.
One should never bet that a developing diagonal will break from the standard form. It will lead you to trouble 9 times out of 10. But once the wave ends, a diagonal with a quirk may be better than any alternative. That is how to use rules. There is no purist solution for this issue; there is only the best solution.