D1 20 EMA & 50 EMA Trend Strategy
I'm currently BETA testing a new system which uses the 20 EMA and the 50 EMA on the D1 chart. The EA can be found at the bottom of this post along with all of the other indicators that I use including the MACD, Moving Averages, and my personalized template.
You don't need to worry about installing any of the files except for the "D1 20 EMA & 50 EMA" file. The other files are there in case you want to have the same chart template as me.
Installing EA Into MT4:
1. Download the file.
2. Shut down your MT4 terminal
3. Go to Expert folder
4. Copy the file into Expert folder.
5. Open MT4
6. Go to the Chart where you want to attach the EA
7. Click the Navigator
8. Browse Expert Advisors folder
9. You will find the file here
10. Double click the file to attach it with your Chart
11. Expert Advisor Property dialog box will appear.
12. Select "Long & Short" for positions
13. Tick (if not) Enable Alerts, Allow Live Trading, Allow Dll imports, Allow import of External Experts.
14. Enable Expert Advisors
15. Under the "Inputs" tab you will put in parameters including Lot Size, Take Profit, Stop Loss, Max Positions, and Delay Hours.
*Lot size is obviously going to be determined by risk tolerance, account size, max positions, and the amount of pairs being traded at any given time. We have recommended Stop Loss and Take Profit parameters as well as delay between each new position, but they really all depend on each trader's personal preference.
Currently testing this system on EUR/USD, EUR/JPY, CHF/JPY, USD/JPY, NZD/JPY, NZD/USD, AUD/JPY, AUD/USD, EUR/AUD, GBP/AUD, EUR/NZD, GBP/NZD, GBP/USD, GBP/JPY, EUR/CAD, USD/CAD, CAD/JPY, AUD/CAD, AUD/NZD, & EUR/GBP.
D1 - 20 EMA & 50 EMA Trend Strategy Rules & Parameters
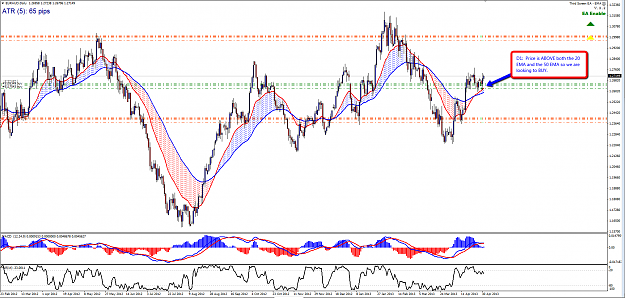
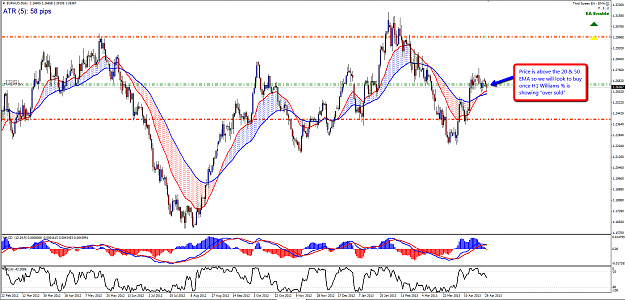
1) Price needs to be above / below BOTH the 20 EMA and 50 EMA on the Daily chart. Above = BUY Below = SELL
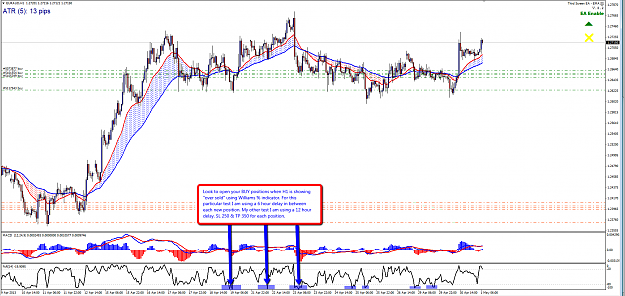
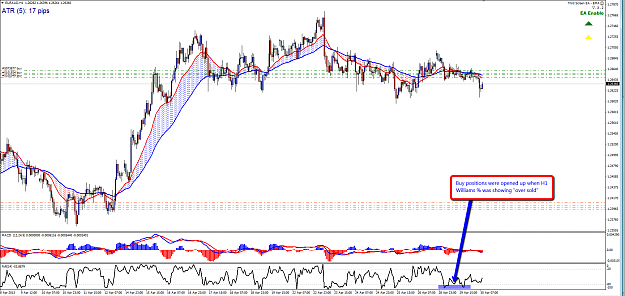
2) New positions are opened up using H1 Williams % Indicator when price is Over Bought / Over Sold. We do not need to wait for H1 to close in OB or OS area. Once price moves into OB / OS area then 1 position opens up.
3) IF price moves in between the 20 EMA and the 50 EMA then NO positions should be opened until price breaks out above/below BOTH the 20 & 50 EMAs. If price is "stuck in between" the two EMA's then this tells us that market is probably ranging so it is best not to add any more positions.
4) NO opposing positions should be opened no matter what (no hedging same currency pair with buy and sell positions)
5) Time Delay in between new positions should be at least 6-12 hours apart. Different time delays between opening new positions are currently being tested on multiple currency pairs.
6) SL 250 & TP 350 (Recommended SL & TP Parameters)
7) Max Positions 8
IMPORTANT: I may look into disabling the EA after all 8 positions are opened per pair and wait until ALL stop losses or take profit targets are hit. Then I will wait to see if each pair is going to continue trending in the same direction or if we may see a potential reversal soon. This can be done by using Price Action at weekly areas of support / resistance.
By doing this it will make it so this strategy is not 100% automated but it should help to eliminate losses which could be avoided by being patient and using price action at support / resistance (PASR) using the weekly charts.
To learn more about PASR go here.
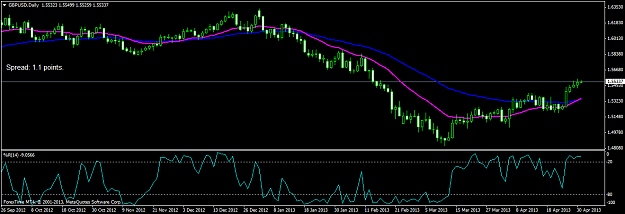
Example: EUR/AUD D1 & H1 Charts
I'm currently BETA testing a new system which uses the 20 EMA and the 50 EMA on the D1 chart. The EA can be found at the bottom of this post along with all of the other indicators that I use including the MACD, Moving Averages, and my personalized template.
You don't need to worry about installing any of the files except for the "D1 20 EMA & 50 EMA" file. The other files are there in case you want to have the same chart template as me.
Installing EA Into MT4:
1. Download the file.
2. Shut down your MT4 terminal
3. Go to Expert folder
4. Copy the file into Expert folder.
5. Open MT4
6. Go to the Chart where you want to attach the EA
7. Click the Navigator
8. Browse Expert Advisors folder
9. You will find the file here
10. Double click the file to attach it with your Chart
11. Expert Advisor Property dialog box will appear.
12. Select "Long & Short" for positions
13. Tick (if not) Enable Alerts, Allow Live Trading, Allow Dll imports, Allow import of External Experts.
14. Enable Expert Advisors
15. Under the "Inputs" tab you will put in parameters including Lot Size, Take Profit, Stop Loss, Max Positions, and Delay Hours.
*Lot size is obviously going to be determined by risk tolerance, account size, max positions, and the amount of pairs being traded at any given time. We have recommended Stop Loss and Take Profit parameters as well as delay between each new position, but they really all depend on each trader's personal preference.
Currently testing this system on EUR/USD, EUR/JPY, CHF/JPY, USD/JPY, NZD/JPY, NZD/USD, AUD/JPY, AUD/USD, EUR/AUD, GBP/AUD, EUR/NZD, GBP/NZD, GBP/USD, GBP/JPY, EUR/CAD, USD/CAD, CAD/JPY, AUD/CAD, AUD/NZD, & EUR/GBP.
D1 - 20 EMA & 50 EMA Trend Strategy Rules & Parameters
1) Price needs to be above / below BOTH the 20 EMA and 50 EMA on the Daily chart. Above = BUY Below = SELL
2) New positions are opened up using H1 Williams % Indicator when price is Over Bought / Over Sold. We do not need to wait for H1 to close in OB or OS area. Once price moves into OB / OS area then 1 position opens up.
3) IF price moves in between the 20 EMA and the 50 EMA then NO positions should be opened until price breaks out above/below BOTH the 20 & 50 EMAs. If price is "stuck in between" the two EMA's then this tells us that market is probably ranging so it is best not to add any more positions.
4) NO opposing positions should be opened no matter what (no hedging same currency pair with buy and sell positions)
5) Time Delay in between new positions should be at least 6-12 hours apart. Different time delays between opening new positions are currently being tested on multiple currency pairs.
6) SL 250 & TP 350 (Recommended SL & TP Parameters)
7) Max Positions 8
IMPORTANT: I may look into disabling the EA after all 8 positions are opened per pair and wait until ALL stop losses or take profit targets are hit. Then I will wait to see if each pair is going to continue trending in the same direction or if we may see a potential reversal soon. This can be done by using Price Action at weekly areas of support / resistance.
By doing this it will make it so this strategy is not 100% automated but it should help to eliminate losses which could be avoided by being patient and using price action at support / resistance (PASR) using the weekly charts.
To learn more about PASR go here.
Example: EUR/AUD D1 & H1 Charts
Attached Image(s) (click to enlarge)
Attached File(s)