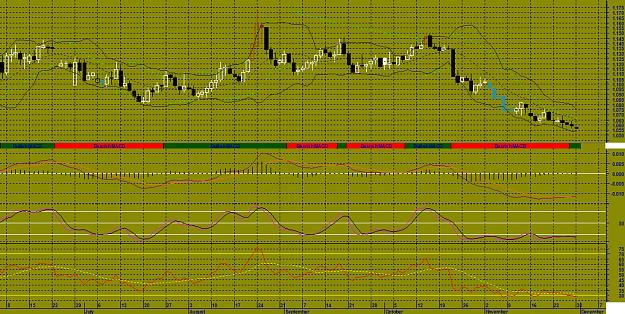
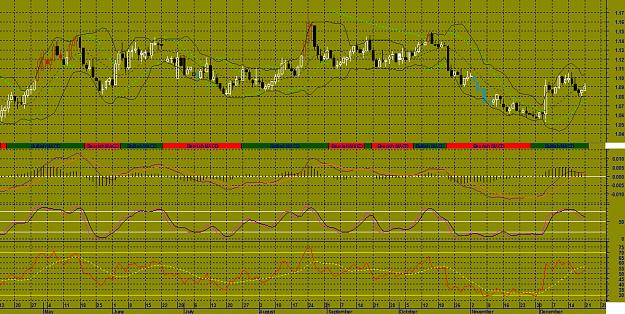
EUR/USD DAILY as of Tuesday, 01 December, 2015
*** Intra-Daily Trading Strategy: BUY Euro Dollar / US Dollar
Buy Target: 1.0580
Enter New BUY on OPEN and exit BUY positions at Target price or at Stop price.
(NOTE: Adjust Stop Loss Price according to your trading risk.)
Do not reverse after exiting. This is a recommendation for INTRA-DAY TRADING only!!!!!
A black body has formed as prices closed lower than open.
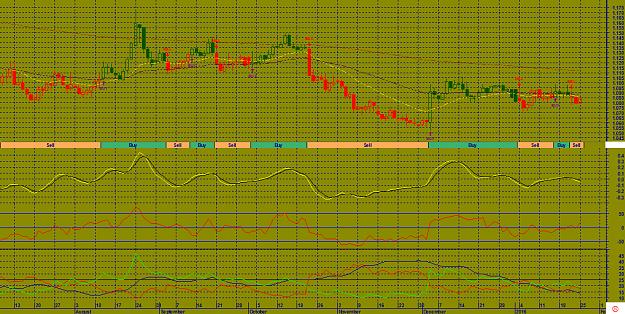
The previous 10 candlestick bars, there are 3 white candles versus 6 black candles with a net of 3 black candles.
The previous 50 candlestick bars, there are 21 white candles versus 28 black candles with a net of 7 black candles.
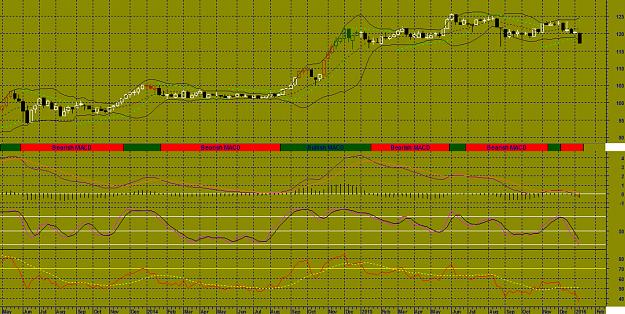
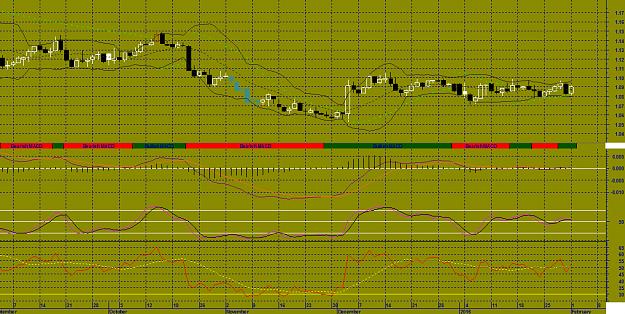
Three black candles has formed during the last three bars. Although these candles were not big enough to create three black crows, the steady downward pattern is bearish.MACD is BULLISH as the MACD is above the signal line.
The MACD crossed above the signal line 1 day(s) ago. Since the MACD crossed the MACD moving average, Euro Dollar / US Dollar's price has decreased 0.24%, and has been fluctuating from a high of 1.064 to a low of 1.056.
The MACD is currently not in an Overbought/Oversold range.
There have been no divergence signals during the last 5 periods.
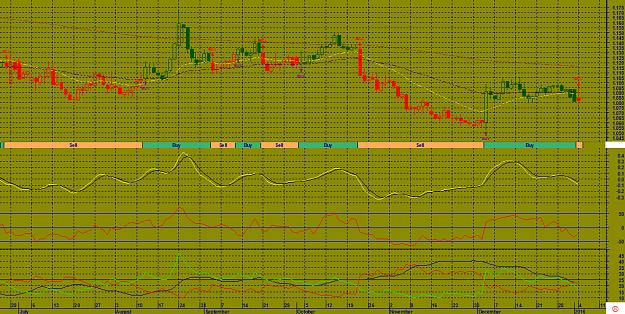
The Stochastic Oscillator is currently below 20. This is an indication of the security being in an "oversold" condition. No Stochastic Buy or Sell signals generated today. The last signal was a Sell 31 Day(s) Ago.
The RSI is below 30. This is where it usually bottoms. The RSI usually forms tops and bottoms before the underlying security. A buy or sell signal generated when the RSI moves out of an overbought/oversold area. The last signal was a Buy 8 day(s) ago.
Currently the RSI does not show any Failure Swings. The price of Euro Dollar / US Dollar has set a new 14-period low while the RSI has not. This is a BULLISH DIVERGENCE.
Currently, the Momentum Oscillator does not show an overbought or oversold condition.
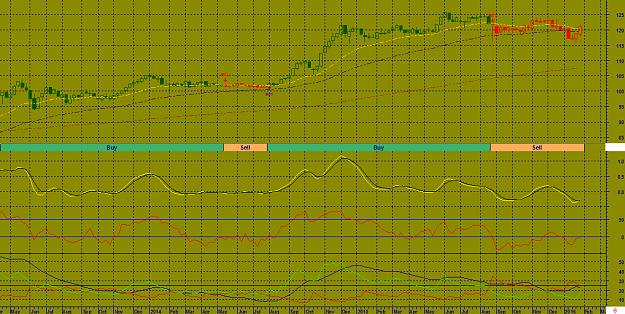
The last Directional Movement Indicators (DMI) signal was a SELL 169 day(s) ago.
There were no SAR signals generated today. The last SAR signal was a Sell 27 day(s) ago.
The close is currently
BELOW its 200 daily moving average
BELOW its 50 daily moving average
BELOW its 20 daily moving average
The current market condition for Euro Dollar / US Dollar is Very Bearish
Euro Dollar / US Dollar closed above the lower Bollinger Band by 13.9%. Bollinger Bands are 25.92% narrower than normal. The current width of the Bollinger Bands (alone) does not suggest anything conclusive about the future volatility or movement of prices.
*** Intra-Daily Trading Strategy: BUY Euro Dollar / US Dollar
Buy Target: 1.0580
Enter New BUY on OPEN and exit BUY positions at Target price or at Stop price.
(NOTE: Adjust Stop Loss Price according to your trading risk.)
Do not reverse after exiting. This is a recommendation for INTRA-DAY TRADING only!!!!!
A black body has formed as prices closed lower than open.
The previous 10 candlestick bars, there are 3 white candles versus 6 black candles with a net of 3 black candles.
The previous 50 candlestick bars, there are 21 white candles versus 28 black candles with a net of 7 black candles.
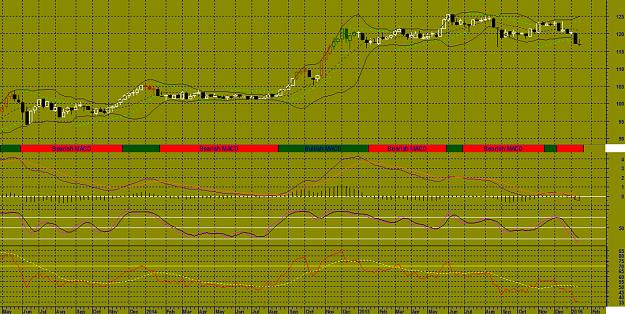
Three black candles has formed during the last three bars. Although these candles were not big enough to create three black crows, the steady downward pattern is bearish.MACD is BULLISH as the MACD is above the signal line.
The MACD crossed above the signal line 1 day(s) ago. Since the MACD crossed the MACD moving average, Euro Dollar / US Dollar's price has decreased 0.24%, and has been fluctuating from a high of 1.064 to a low of 1.056.
The MACD is currently not in an Overbought/Oversold range.
There have been no divergence signals during the last 5 periods.
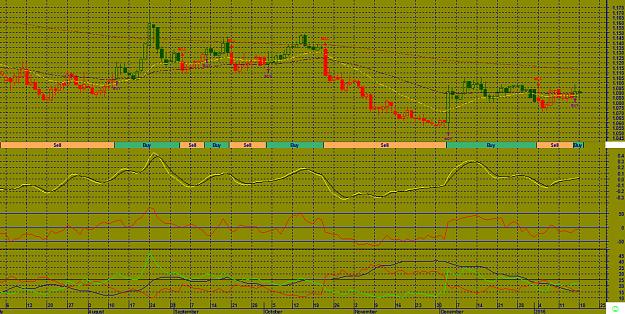
The Stochastic Oscillator is currently below 20. This is an indication of the security being in an "oversold" condition. No Stochastic Buy or Sell signals generated today. The last signal was a Sell 31 Day(s) Ago.
The RSI is below 30. This is where it usually bottoms. The RSI usually forms tops and bottoms before the underlying security. A buy or sell signal generated when the RSI moves out of an overbought/oversold area. The last signal was a Buy 8 day(s) ago.
Currently the RSI does not show any Failure Swings. The price of Euro Dollar / US Dollar has set a new 14-period low while the RSI has not. This is a BULLISH DIVERGENCE.
Currently, the Momentum Oscillator does not show an overbought or oversold condition.
The last Directional Movement Indicators (DMI) signal was a SELL 169 day(s) ago.
There were no SAR signals generated today. The last SAR signal was a Sell 27 day(s) ago.
The close is currently
BELOW its 200 daily moving average
BELOW its 50 daily moving average
BELOW its 20 daily moving average
The current market condition for Euro Dollar / US Dollar is Very Bearish
Euro Dollar / US Dollar closed above the lower Bollinger Band by 13.9%. Bollinger Bands are 25.92% narrower than normal. The current width of the Bollinger Bands (alone) does not suggest anything conclusive about the future volatility or movement of prices.
Attached Image (click to enlarge)