Happy Birthday Mr. Dadas
Wishing you healthy, prosperous, and happy
I've been trading with the day candle strategy which you teach me Mr. Dadas collaborating with my community strategy in Indonesia forum it really worked out for me but since it's not pure PTECZ so I'm not posting it at this thread but I always read this thread from time to time, and thank you for your time teaching me Mr. Dadas
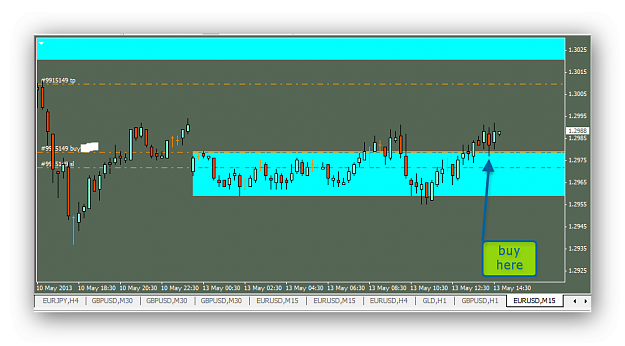
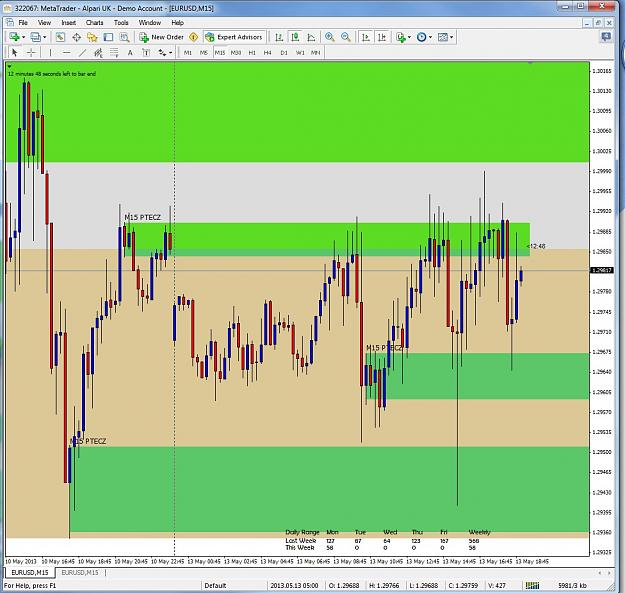
@P.Action Even just from M15 view: {image} Man, you have got to learn! This is the difference between +20Pips or - SL.
Ignored
Dadas: This is brilliant stuff!
You must have taught me well, because I am pleased to say that my own chart, with 15min PTECZ's, looks almost exactly the same as yours.
I am a complete convert to the PA approach, and your Zone approach is the simplest way I have ever seen to give a clear picture of Price Action on any timeframe.
Thank you so much for sharing all your excellent work with us all!!!
{quote} Dadas: This is brilliant stuff! You must have taught me well, because I am pleased to say that my own chart, with 15min PTECZ's, looks almost exactly the same as yours. I am a complete convert to the PA approach, and your Zone approach is the simplest way I have ever seen to give a clear picture of Price Action on any timeframe. Thank you so much for sharing all your excellent work with us all!!! You surely deserve a very Happy Birthday!
Ignored
Great that you learned even without posting a single chart!
Ok and here´s what i don´t understand, Dadas. You were commenting on my charts (post 1819) asking why my analysis was so complicated. You were pointing out the 4H PTECZ just underneath the monthly. If it breaks up, it´s up and if it´s breaks down it´s down. The monthly PTECZ it there so we have the target. All right I can see that, it makes perfect sense and I know how you manage to take a lot of trade per day now, I saw a million set-ups. Just know you´re S/R, right?
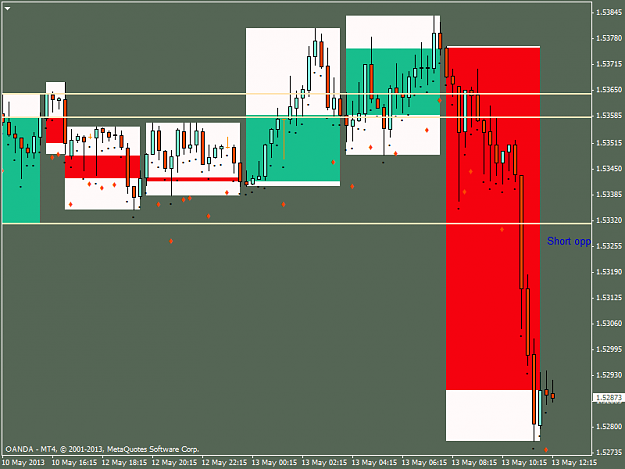
Now, in post 1850 you were criticizing P.Actions trade, saying it´s against the larger trend. I completely agree with that. Actually, I took another short trade on this pair earlier today.
So my point here is did I not anlyze the larger trend in my charts (post 1813)? Did I not realize that the larger trend was down and was it not reasonable to wait for price to come back were the green arrow is (4H chart, post 1813) and enter short here because it´s with the larger trend? I know a lot of posts but I have to ask this.
Ok and here´s what i don´t understand, Dadas. You were commenting on my charts (post 1819) asking why my analysis was so complicated. You were pointing out the 4H PTECZ just underneath the monthly. If it breaks up, it´s up and if it´s breaks down it´s down. The monthly PTECZ it there so we have the target. All right I can see that, it makes perfect sense and I know how you manage to take a lot of trade per day now, I saw a million set-ups. Just know you´re S/R, right? Now, in post 1850 you were criticizing P.Actions...
Ignored
I did not critisise your analysis!
I showed a simpler way!
If that is what you are talking about.
I do not remember, sorry.
I am always moving on, you either keep pace, or do not expect me to go back, please!
I was just pointing out to P.Action that the Trend was Bearish.
Today there might be just Consolidation.
You see my PTECZs and my plotting on P.Action's chart.
You want to go Long, I have nothing against!
Just, go Long at the Bottom not the Top!
And know your S/R!
As you can see on M15, it is neither Up, nor Down!
Attached Image (click to enlarge)
It is Flat, and when EURUSD is Flat, you really have got to know what you are doing, or take a Break!
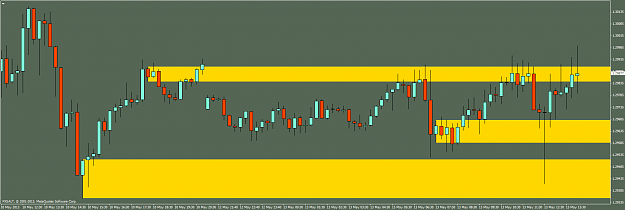
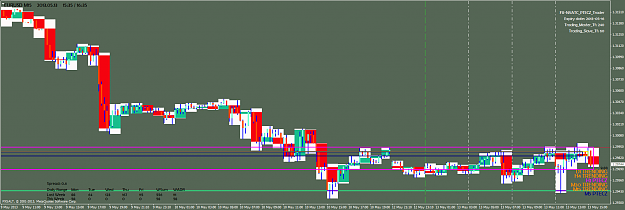
and marked the 50.0% Fibo level from the body of the April Monthly candle, as price is currently bouncing off this level (also the 61.8% level) . BRN (Big Round Number) 1.3000 is also key. {image}
Ignored
These are BS! Just vivid imagination!
If Price is bouncing off, there is a reason, there is a real S/R Zone - PTECZ. As you have, correctly, plotted!
{quote} Great job, those are the real elements of the chart! The real elements of Price Action. {quote} These are BS! Just vivid imagination! If Price is bouncing off, there is a reason, there is a real S/R Zone - PTECZ. As you have, correctly, plotted!
Ignored
Thanks for the comments, Dadas.
I have amended my post above, to show just the key Price Action elements of the 15-min chart, plus a Daily chart with Monthly OHLC lines for context.
{quote} Thanks for the comments, Dadas. I have amended my post above, to show just the key Price Action elements of the 15-min chart, plus a Daily chart with Monthly OHLC lines for context.
So my point here is did I not anlyze the larger trend in my charts (post 1813)? Did I not realize that the larger trend was down and was it not reasonable to wait for price to come back were the green arrow is (4H chart, post 1813) and enter short here because it´s with the larger trend? I know a lot of posts but I have to ask this. P.S. Happy Birthday
Ignored
Like I said, you did it fine, great!
Up to the MN PTECZ is still some Pips!
If you want to wait, you wait, it is your choice!
Why wait if you can take Pips?
Of course, if you can work from M1 and Enter very early!
If you can only work the higher Tfs, you wait!
One guy was trying to teach PA and he asked me to wait potentially 3+ weeks for retrace
and ignore potential +450 Pips on the way,
but could never answer my question what my reward would be!
PS. Plus, I think it was the Friday chart.
We do not see the Saturday and Sunday quotations on the charts,
so, how can we make the right analysis over the weekend?
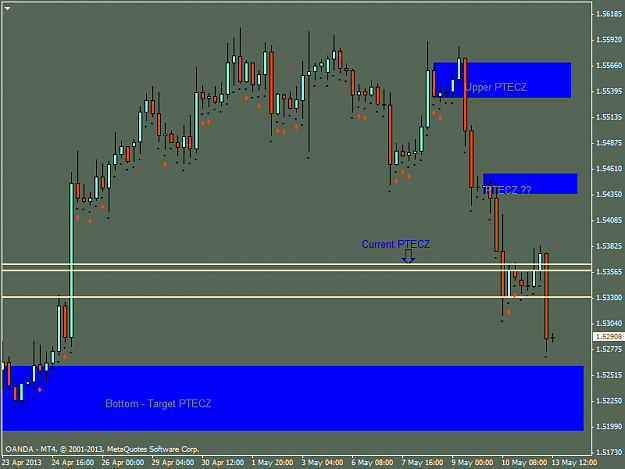
Nervous as first chart posted. Feedback really welcome and mistakes pointed out would be great. Thank you in advance.
Attached Image (click to enlarge)
On the 4 hour chart, I am still wondering if I have placed the PTECZs correctly. The lower one "Bottom PTECZ target", I still query. Should this be the hammer swing low a few steps back?
The middle PTECZ with "???". Think I am happy with this but feedback appreciated.
Current one happy as labeled a few posts back :-)
Upper one I think I have correctly labelled.
Plan is to wait for a retracement as labeled (1.5332 region).
Thanks for any replies/feedback. Sorry if questions are basic but on steep learning curve and trying to keep up.