I am open to new ideas, as long as they make sence.
There is always something to learn, if you can listen to what someone else is saying.
The last video I posted is very informative and carries a few pearls.
One of the most important information in understanding Price Action is Price Volume.
The MT4 Volume Indicator is poor.
I would recommend the SonicR PVA Volumes(White).mq4 or SonicR PVA Volumes(Black).mq4
together with the Normalize_Volume_Oscilator.mq4 also from the SonicR packet V3,
found in the packet, here:
http://www.forexfactory.com/attachme...2&d=1247195867
An even simpler way to use the available Volume information is to use the SonicR Volume Candles.mq4,
found in the packet, here:
http://www.forexfactory.com/attachme...2&d=1369521618
cause it gives you all the information included in the Candles, so you don't need to read anything else.
And, obviously, you get more information in the Candles than from the standard Candles.
Now, the story gets even more interesting:
AUDUSD MN:
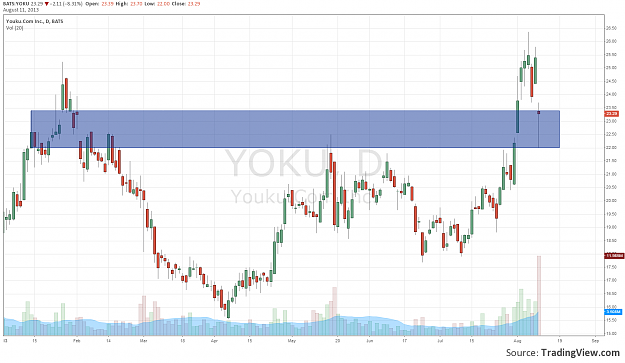
On the Monthly chart we see that Price is heading North, Bullish and is inside Resistance.
1/3 of the Month is behind us.
We see that there was Big Bearish Volume (FireBrick) and the previous Month the Volume was Normal (Tomato).
So far, this week was Bullish with Normal Volume. (Normal means average).
Now, there is one more information missing:
Which segment of the Market is generating this move?
Is it the Big-Lots Institutions (1000 Lots up), or is it the Small-Lots Traders (100 Lots down)?
If it's the Big-Lots, we want to go along, cause there is strength and potential.
If it's the Small-Lots, then we must be careful, cause there is little power!
Here, a request!
If anyone can share an Indicator which shows the Lot Volume or Accumulation/Distribution based on Volume,
please share with us, as this will help identify who is behind the current Price Action!
Checking on the Custom_Range_Stats.mq4, we can see that the Monthly Range is at reasonable average (367),
though there still might be Up Potential, but the Price is at the Top half of the Range.
So, we continue to W1:
The MN story confirms itself.
The Big-Volumes were pulling Price Down,
The Normal-Volumes were pushing Price back Up.
However, this week shows the growing strength of Bulls.
The week before was also Normal-Volumes Down (Tomato).
W1 CSCZs show where the Potentials are, and Custom_Range confirms
the nearing of the of the important Resistance.
Next, the D1:
The Daily chart does nothing more than confirm the above stated story of the Price.
Additionally optimising the Potential Stops.
This is all the Swing-Trader or Position-Trader needs in order to find the right Entry from H4 or H1.
Then, just check Price Action every day and Follow The Price.
For the Day-Trader:
The Day-Trader will find the above analysis very useful for defining the General Trend for the Day.
However, the Day-Trader will operate on the M15 or M5, or even the M1 chart.
So, having the W1 CSCZ S/R Zones, I would go to H4 or H1:
This would give me the above picture.
Again, we see how the Volumes are working.
This is going with the trend.
This is how it works on the H1 chart:
And, finally, the M5 chart:
There is practically all the information we need for Trading.
Some extra helpers are Session Open Lines (Tokyo, London, New York),
and specific Session Period Boxes - Best Trading Time for me.
Again, a request!
If anyone can share an Indicator which shows the Lot Volume or Accumulation/Distribution based on Volume,
please share with us, as this will help identify who is behind the current Price Action!
There is always something to learn, if you can listen to what someone else is saying.
The last video I posted is very informative and carries a few pearls.
One of the most important information in understanding Price Action is Price Volume.
The MT4 Volume Indicator is poor.
I would recommend the SonicR PVA Volumes(White).mq4 or SonicR PVA Volumes(Black).mq4
together with the Normalize_Volume_Oscilator.mq4 also from the SonicR packet V3,
found in the packet, here:
http://www.forexfactory.com/attachme...2&d=1247195867
An even simpler way to use the available Volume information is to use the SonicR Volume Candles.mq4,
found in the packet, here:
http://www.forexfactory.com/attachme...2&d=1369521618
cause it gives you all the information included in the Candles, so you don't need to read anything else.
And, obviously, you get more information in the Candles than from the standard Candles.
Now, the story gets even more interesting:
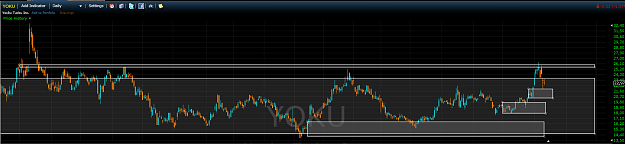
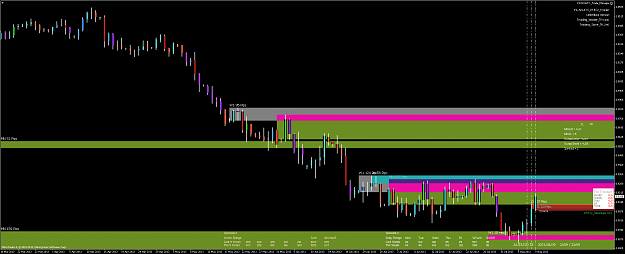
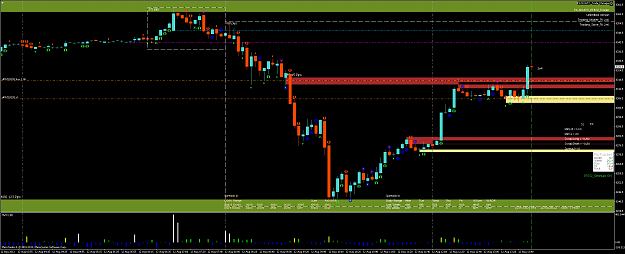
AUDUSD MN:
Attached Image (click to enlarge)
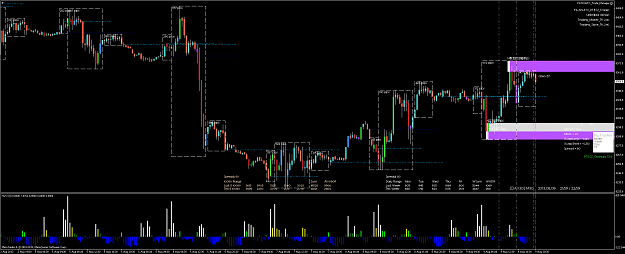
On the Monthly chart we see that Price is heading North, Bullish and is inside Resistance.
1/3 of the Month is behind us.
We see that there was Big Bearish Volume (FireBrick) and the previous Month the Volume was Normal (Tomato).
So far, this week was Bullish with Normal Volume. (Normal means average).
Now, there is one more information missing:
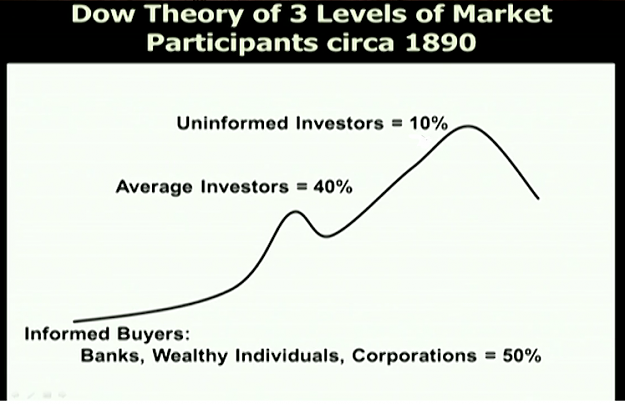
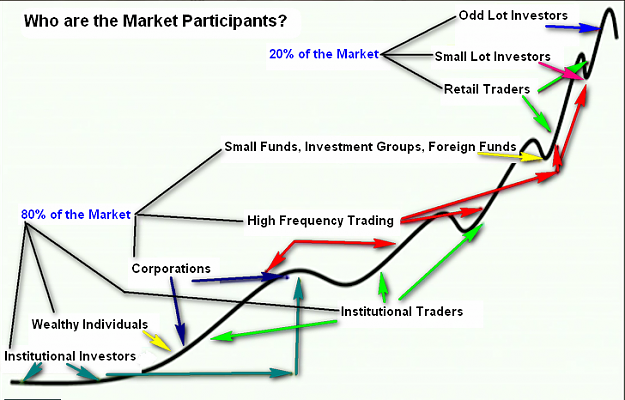
Which segment of the Market is generating this move?
Is it the Big-Lots Institutions (1000 Lots up), or is it the Small-Lots Traders (100 Lots down)?
If it's the Big-Lots, we want to go along, cause there is strength and potential.
If it's the Small-Lots, then we must be careful, cause there is little power!
Here, a request!
If anyone can share an Indicator which shows the Lot Volume or Accumulation/Distribution based on Volume,
please share with us, as this will help identify who is behind the current Price Action!
Checking on the Custom_Range_Stats.mq4, we can see that the Monthly Range is at reasonable average (367),
though there still might be Up Potential, but the Price is at the Top half of the Range.
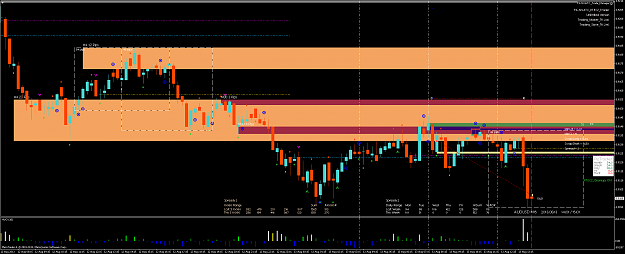
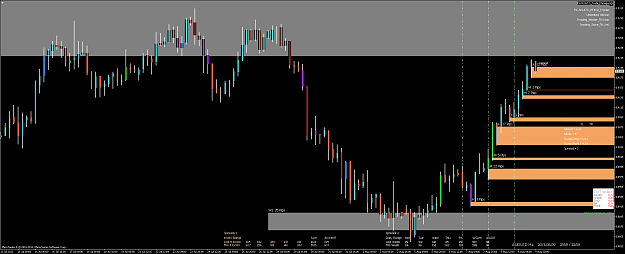
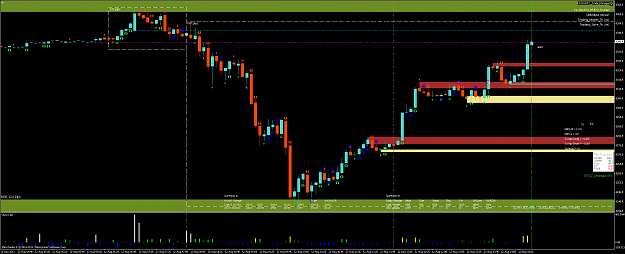
So, we continue to W1:
Attached Image (click to enlarge)
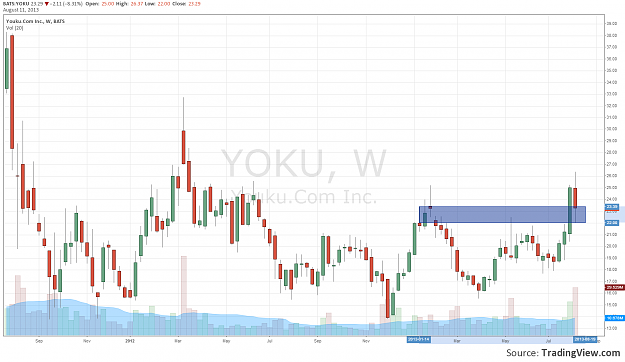
The MN story confirms itself.
The Big-Volumes were pulling Price Down,
The Normal-Volumes were pushing Price back Up.
However, this week shows the growing strength of Bulls.
The week before was also Normal-Volumes Down (Tomato).
W1 CSCZs show where the Potentials are, and Custom_Range confirms
the nearing of the of the important Resistance.
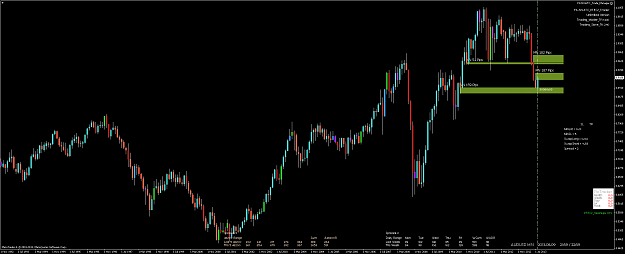
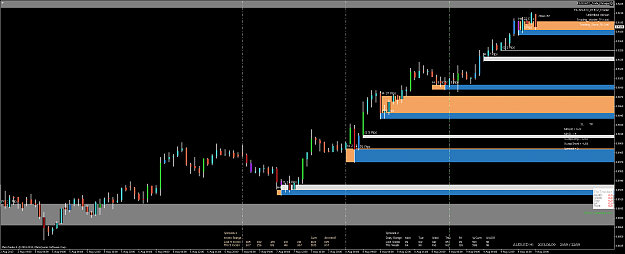
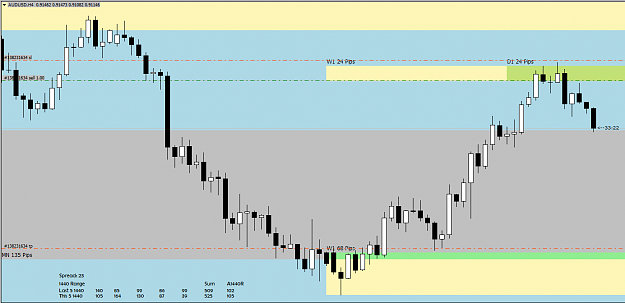
Next, the D1:
Attached Image (click to enlarge)
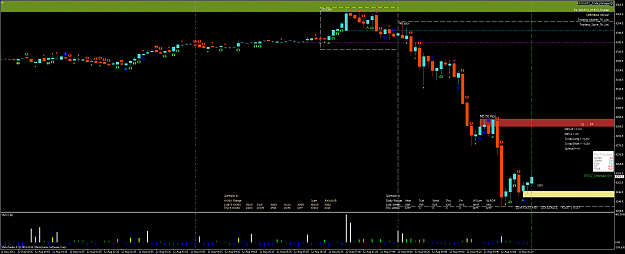
The Daily chart does nothing more than confirm the above stated story of the Price.
Additionally optimising the Potential Stops.
This is all the Swing-Trader or Position-Trader needs in order to find the right Entry from H4 or H1.
Then, just check Price Action every day and Follow The Price.
For the Day-Trader:
The Day-Trader will find the above analysis very useful for defining the General Trend for the Day.
However, the Day-Trader will operate on the M15 or M5, or even the M1 chart.
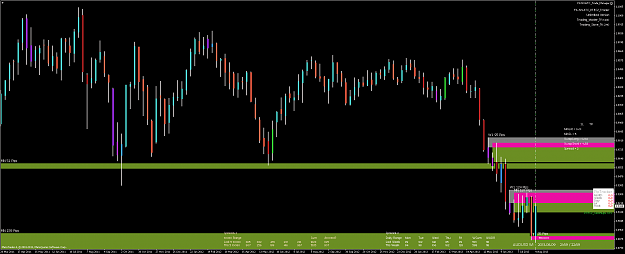
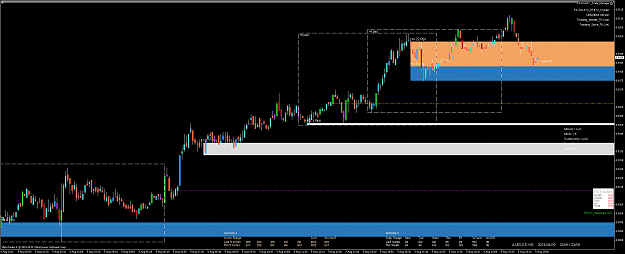
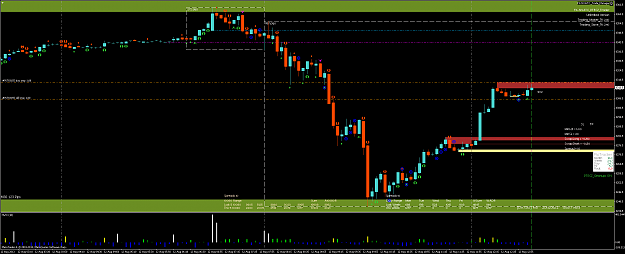
So, having the W1 CSCZ S/R Zones, I would go to H4 or H1:
Attached Image (click to enlarge)
This would give me the above picture.
Again, we see how the Volumes are working.
This is going with the trend.
This is how it works on the H1 chart:
Attached Image (click to enlarge)
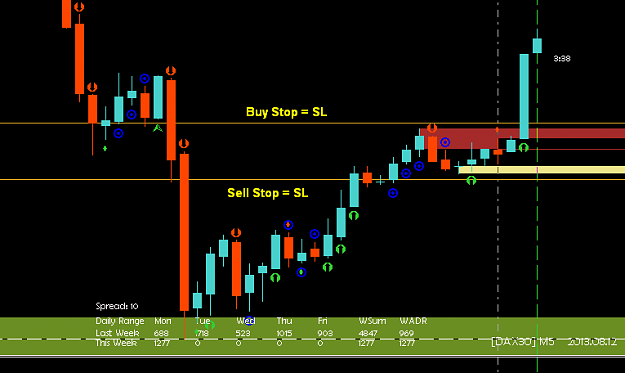
And, finally, the M5 chart:
Attached Image (click to enlarge)
There is practically all the information we need for Trading.
Some extra helpers are Session Open Lines (Tokyo, London, New York),
and specific Session Period Boxes - Best Trading Time for me.
Again, a request!
If anyone can share an Indicator which shows the Lot Volume or Accumulation/Distribution based on Volume,
please share with us, as this will help identify who is behind the current Price Action!
Trade the facts, not opinions.

![Click to Enlarge
Name: [dax30]h1.png
Size: 57 KB](/attachment/image/1252413/thumbnail?d=1376380253)